WebGCM
A global climate model that runs in your browser.
Climate model
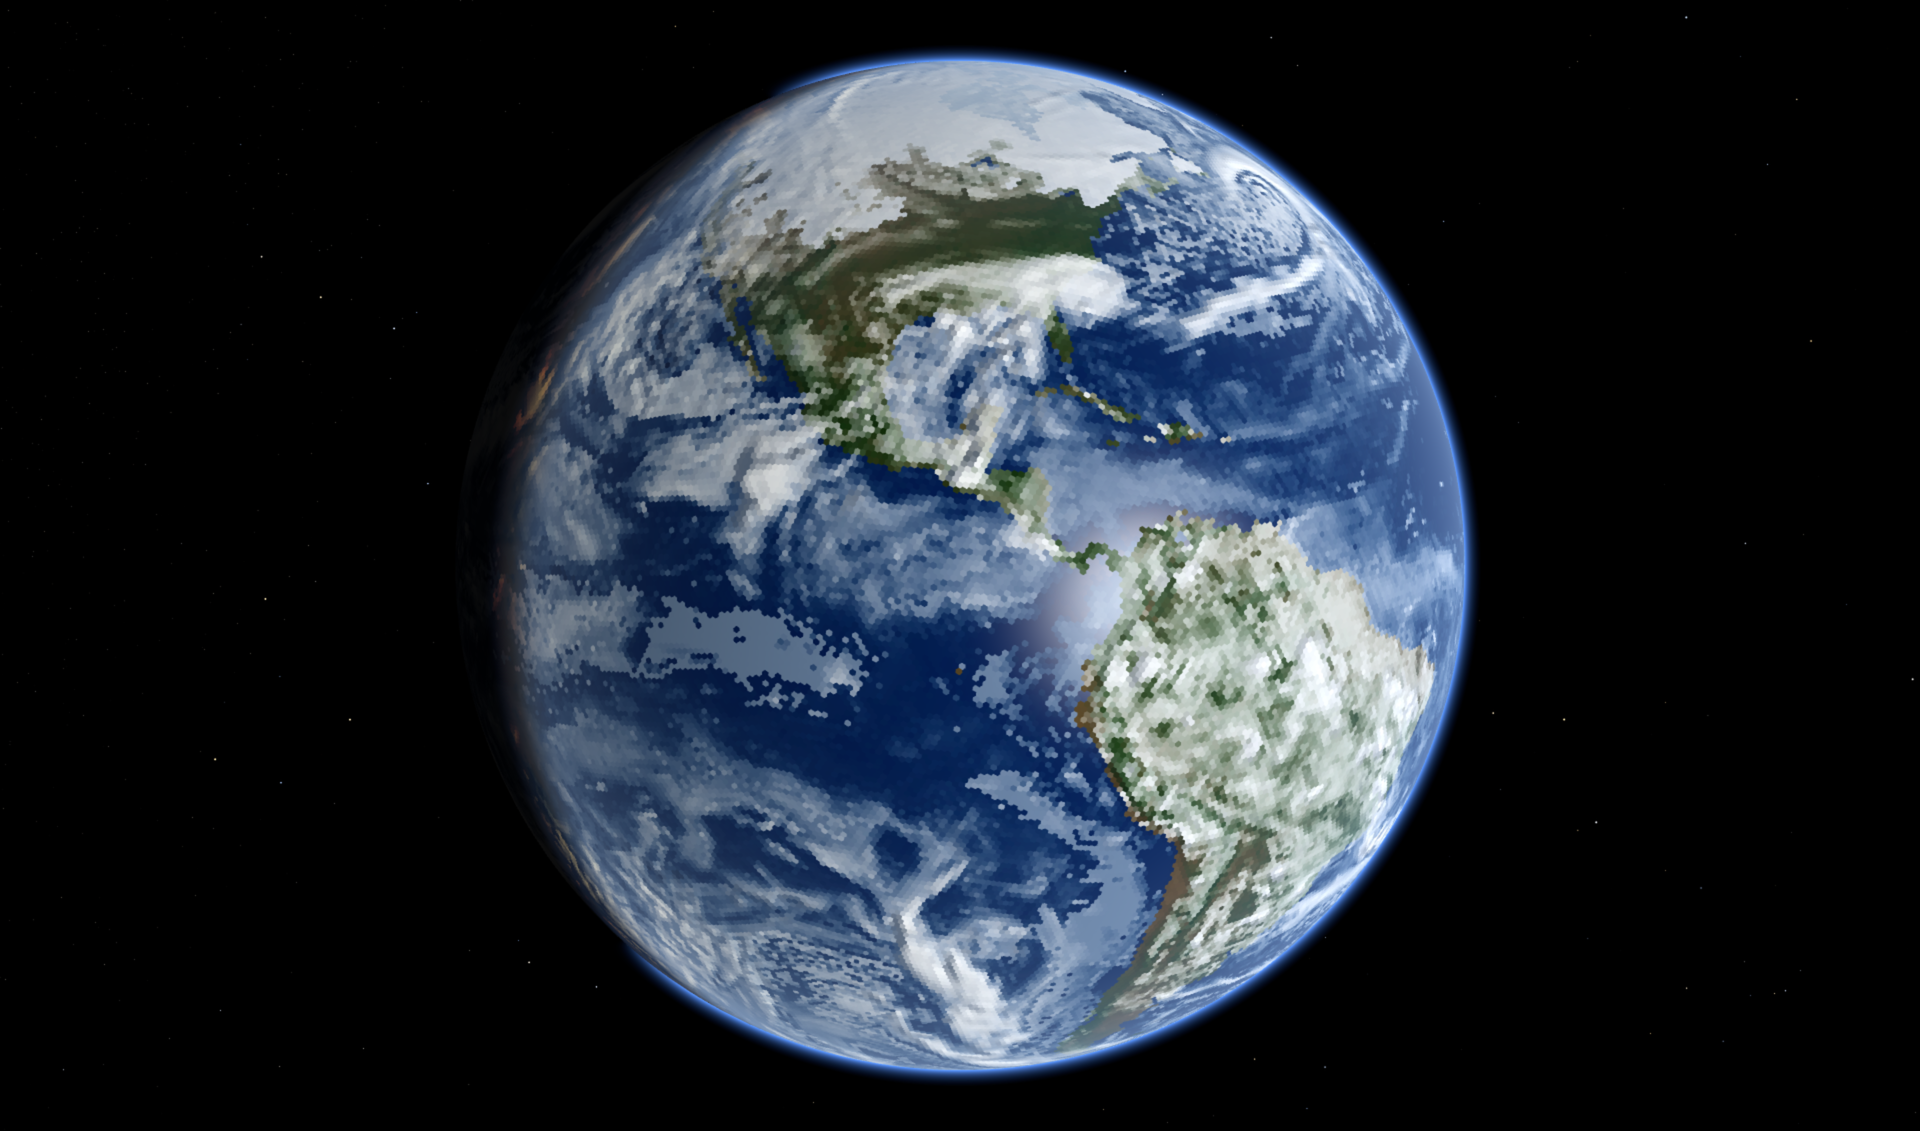
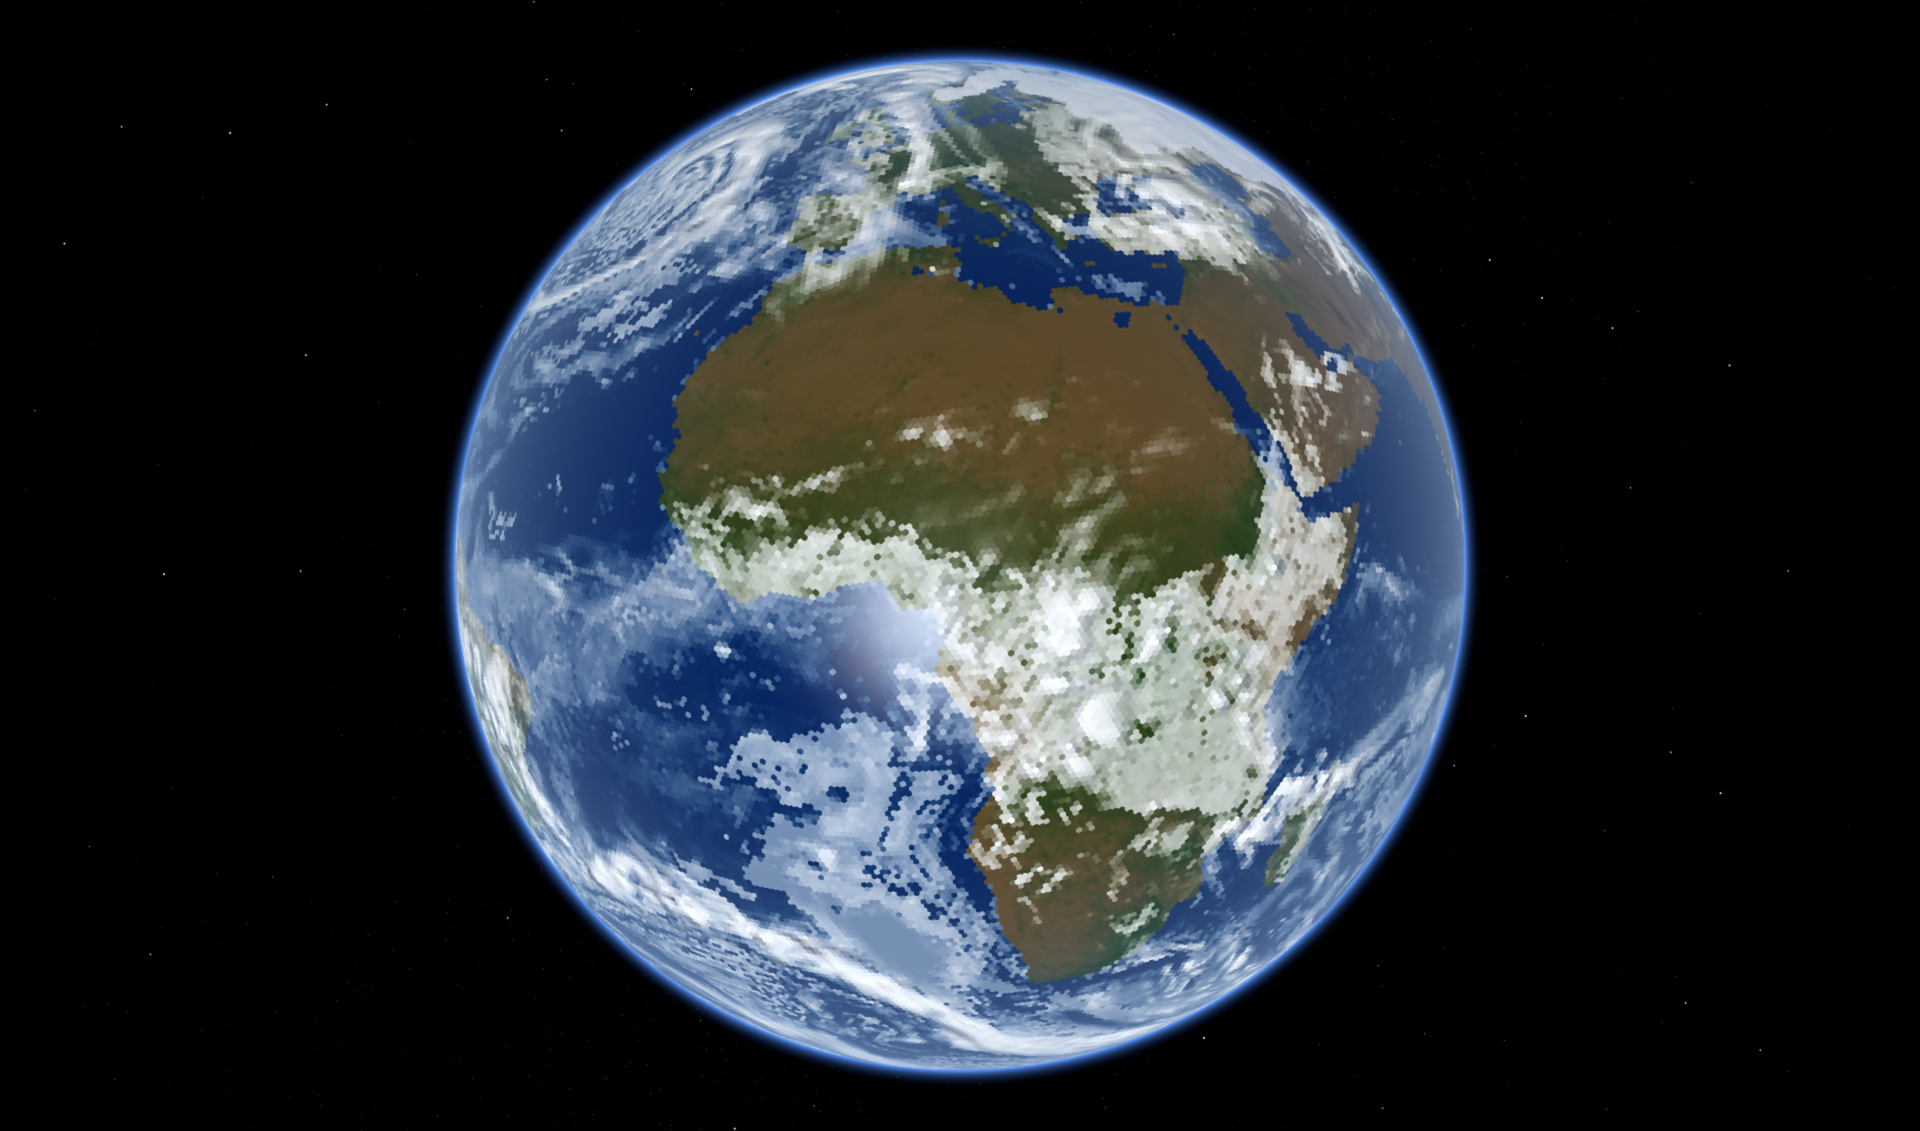
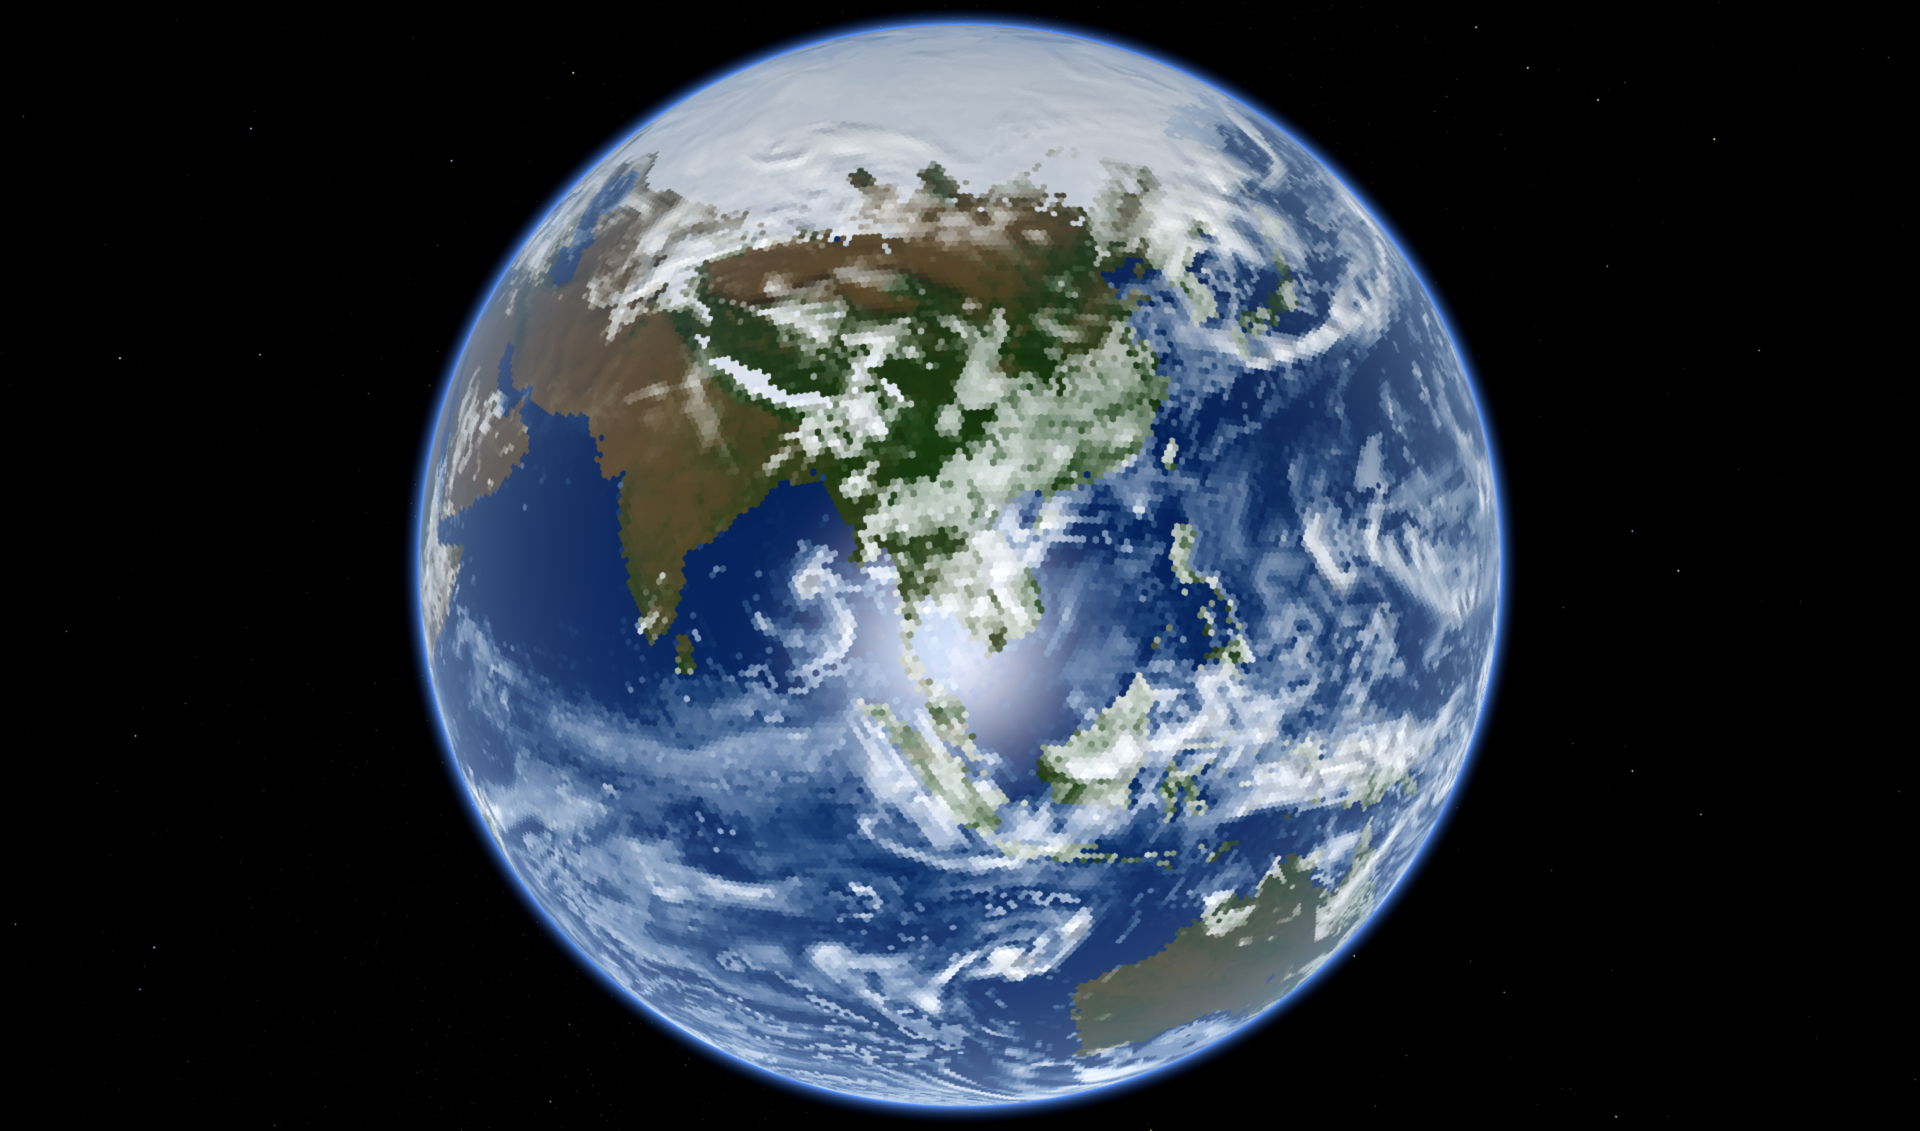
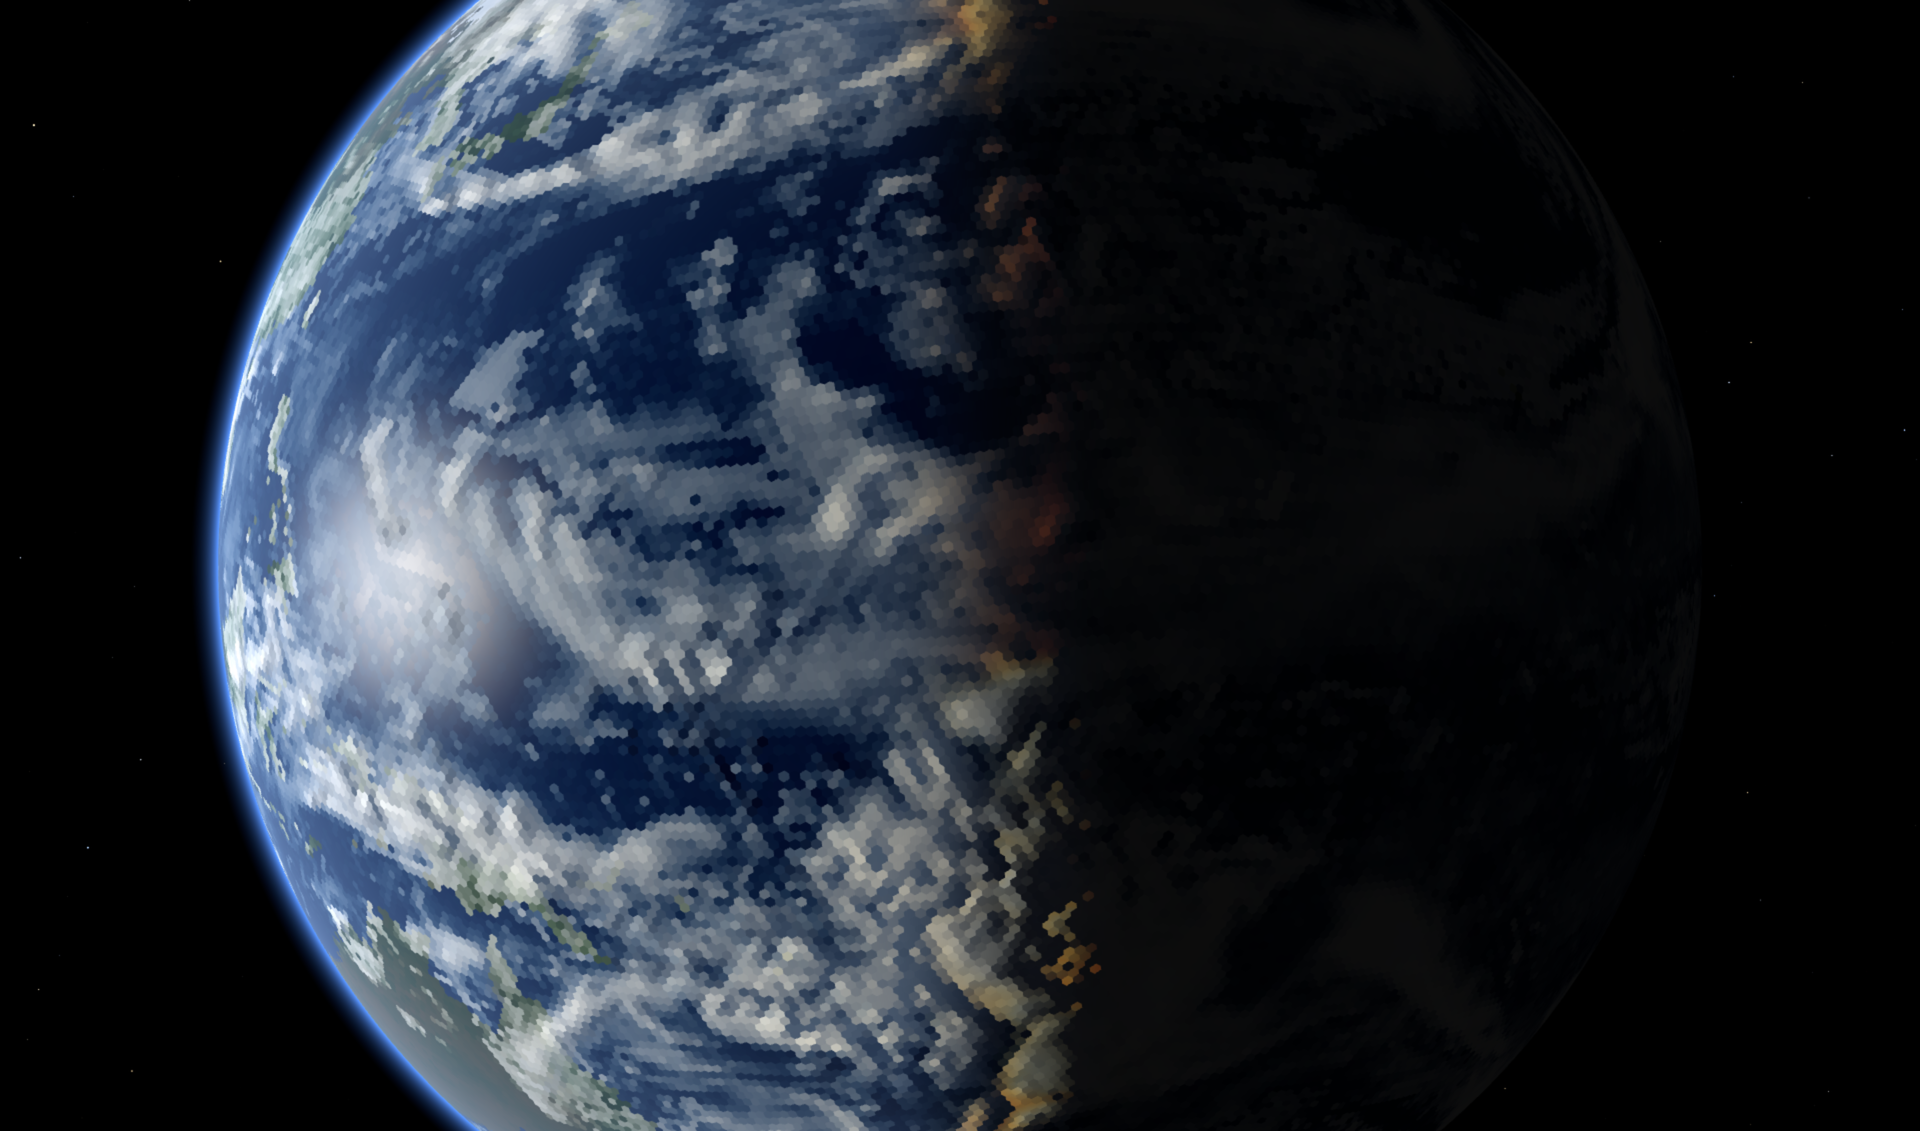
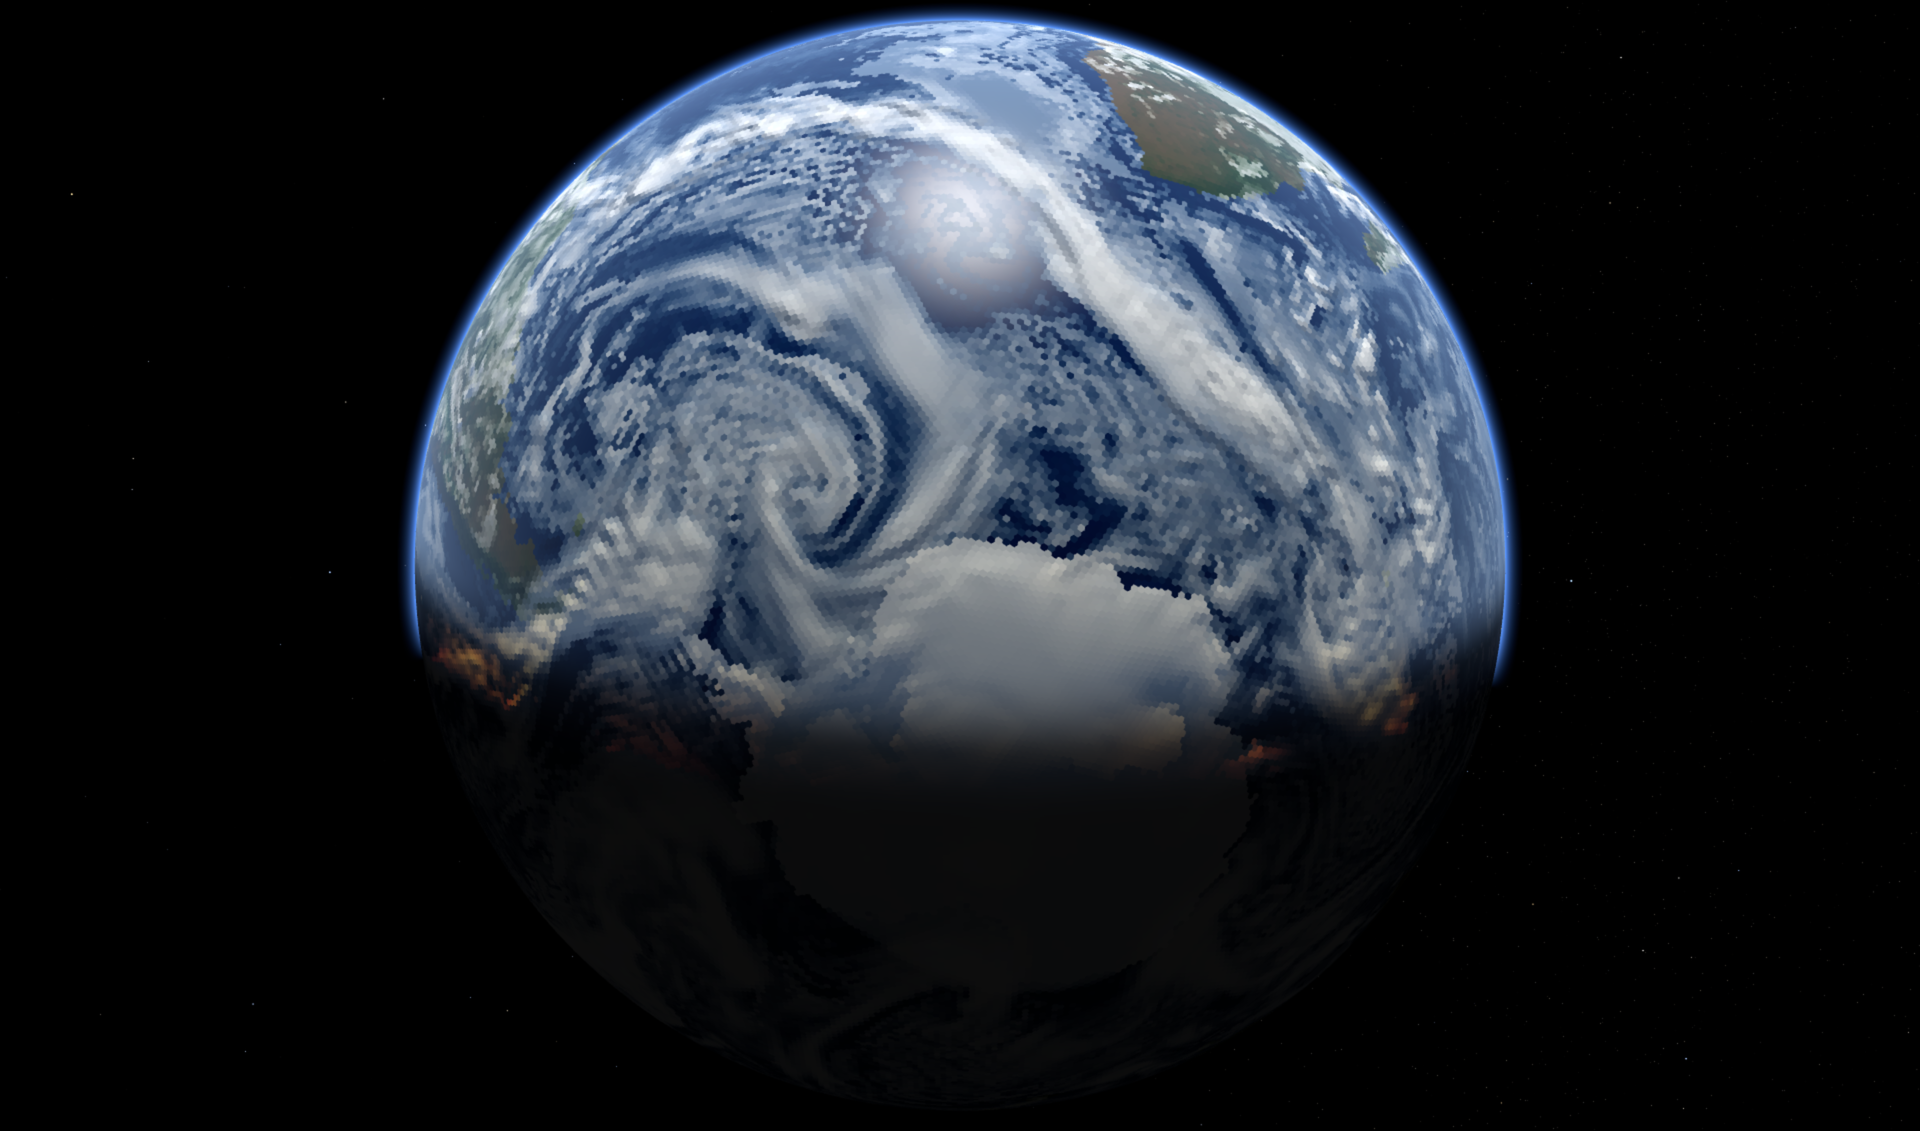
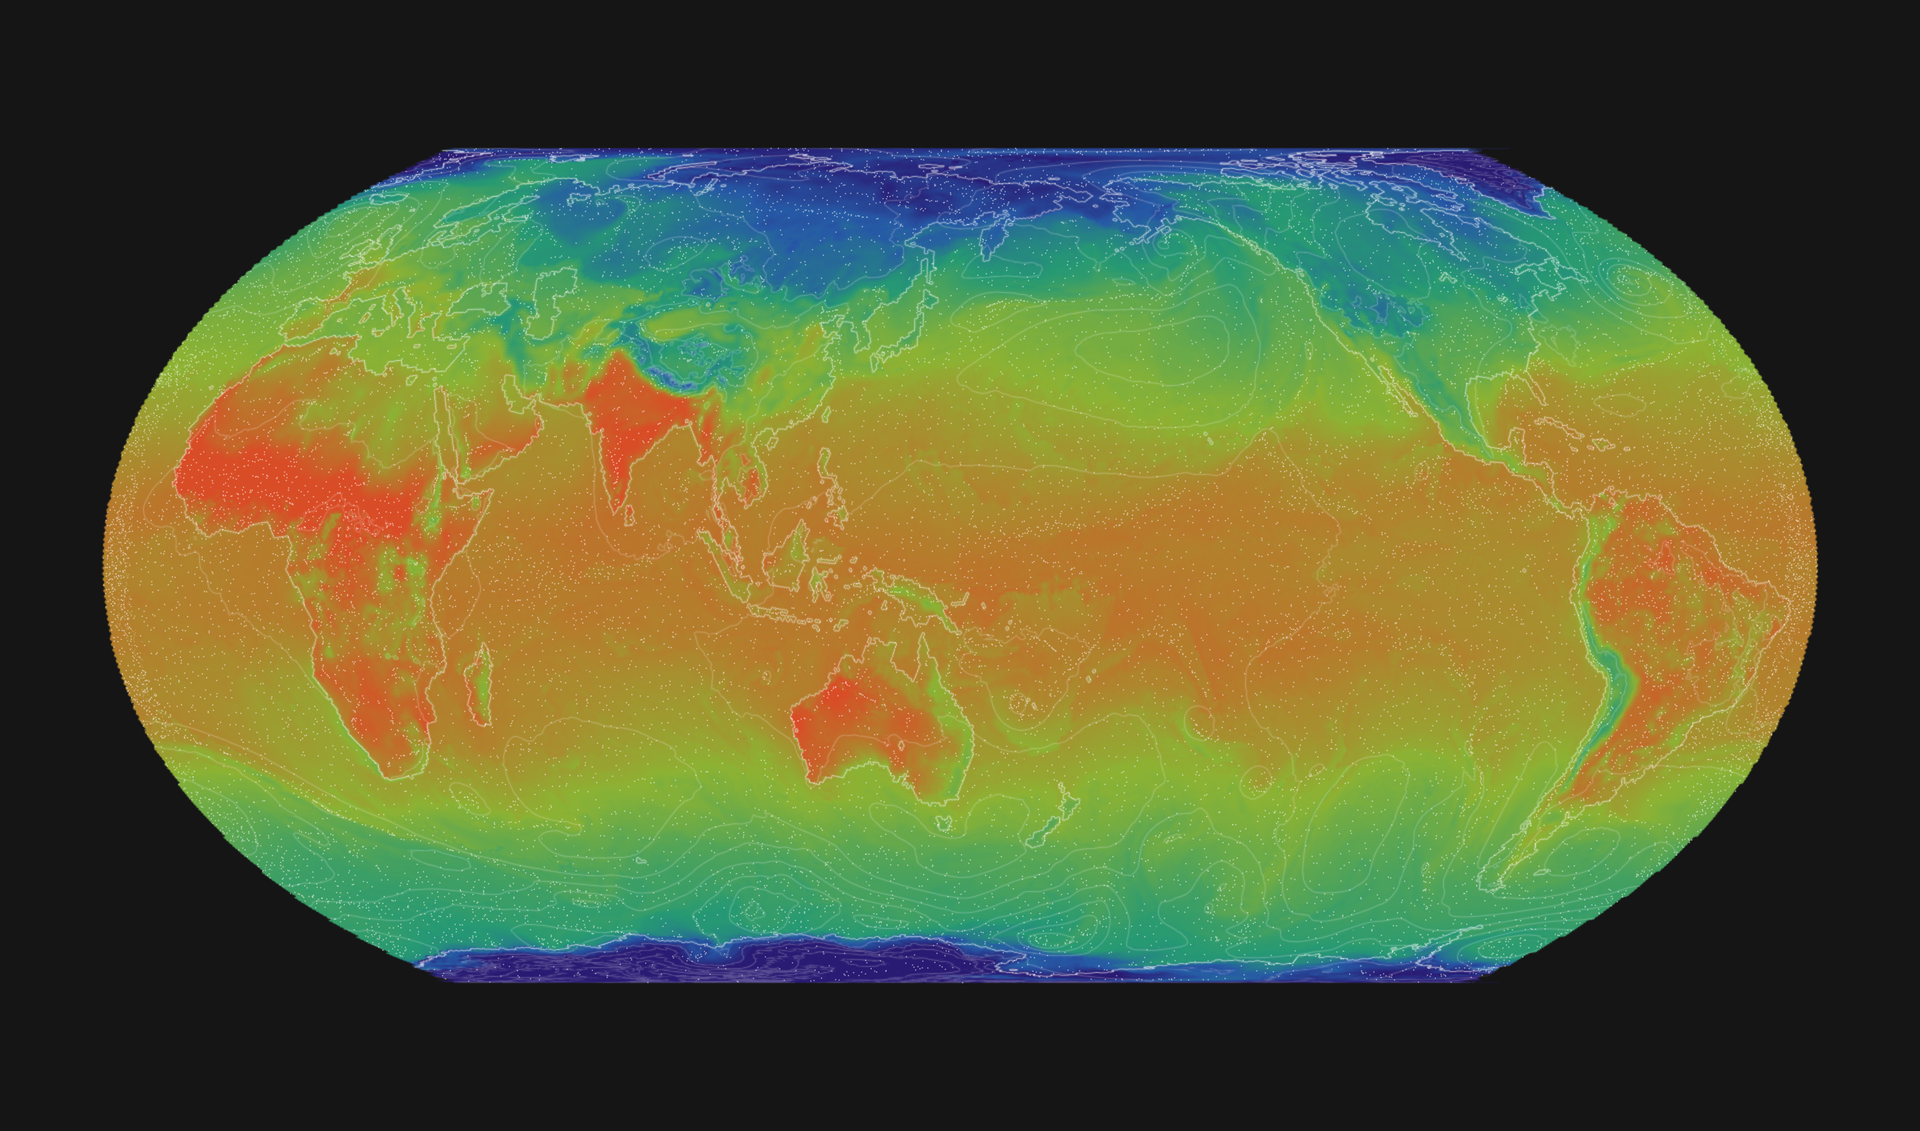
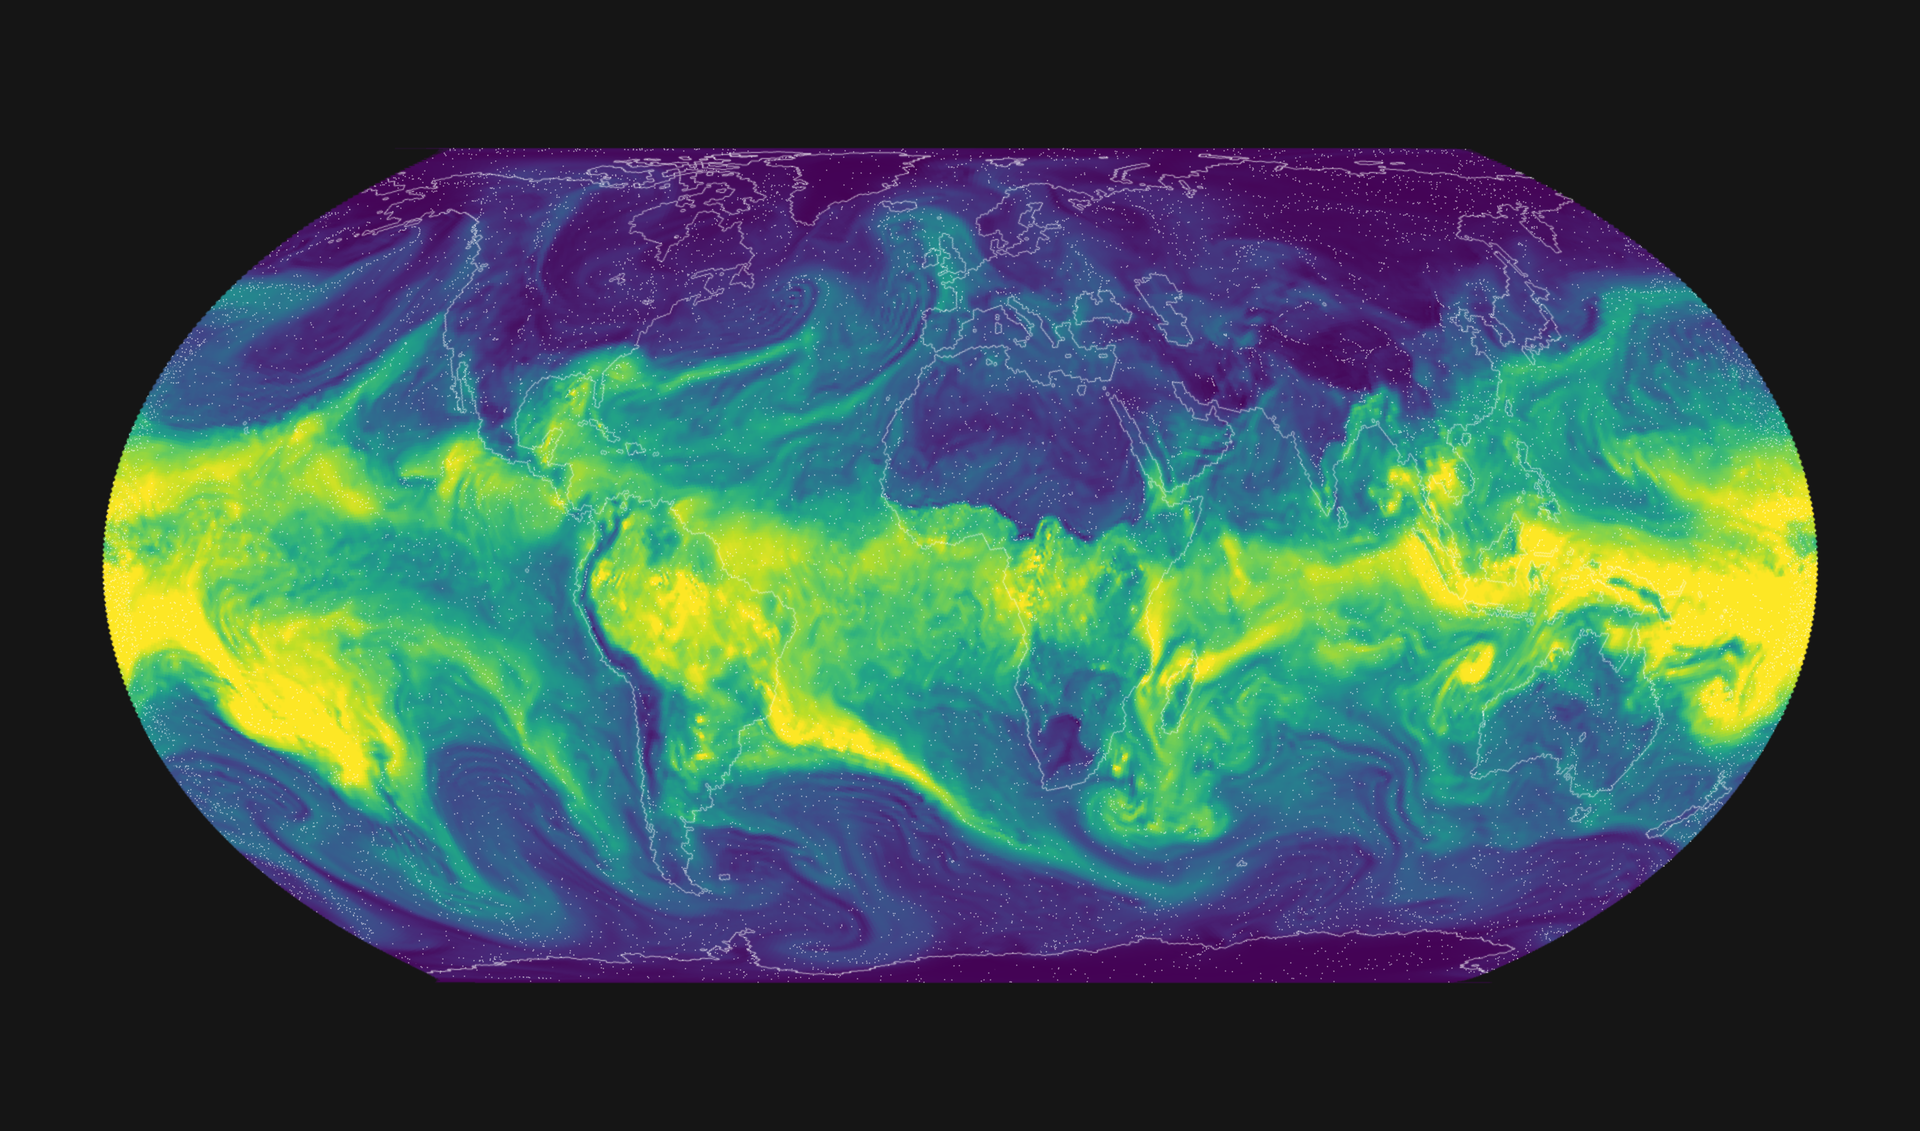
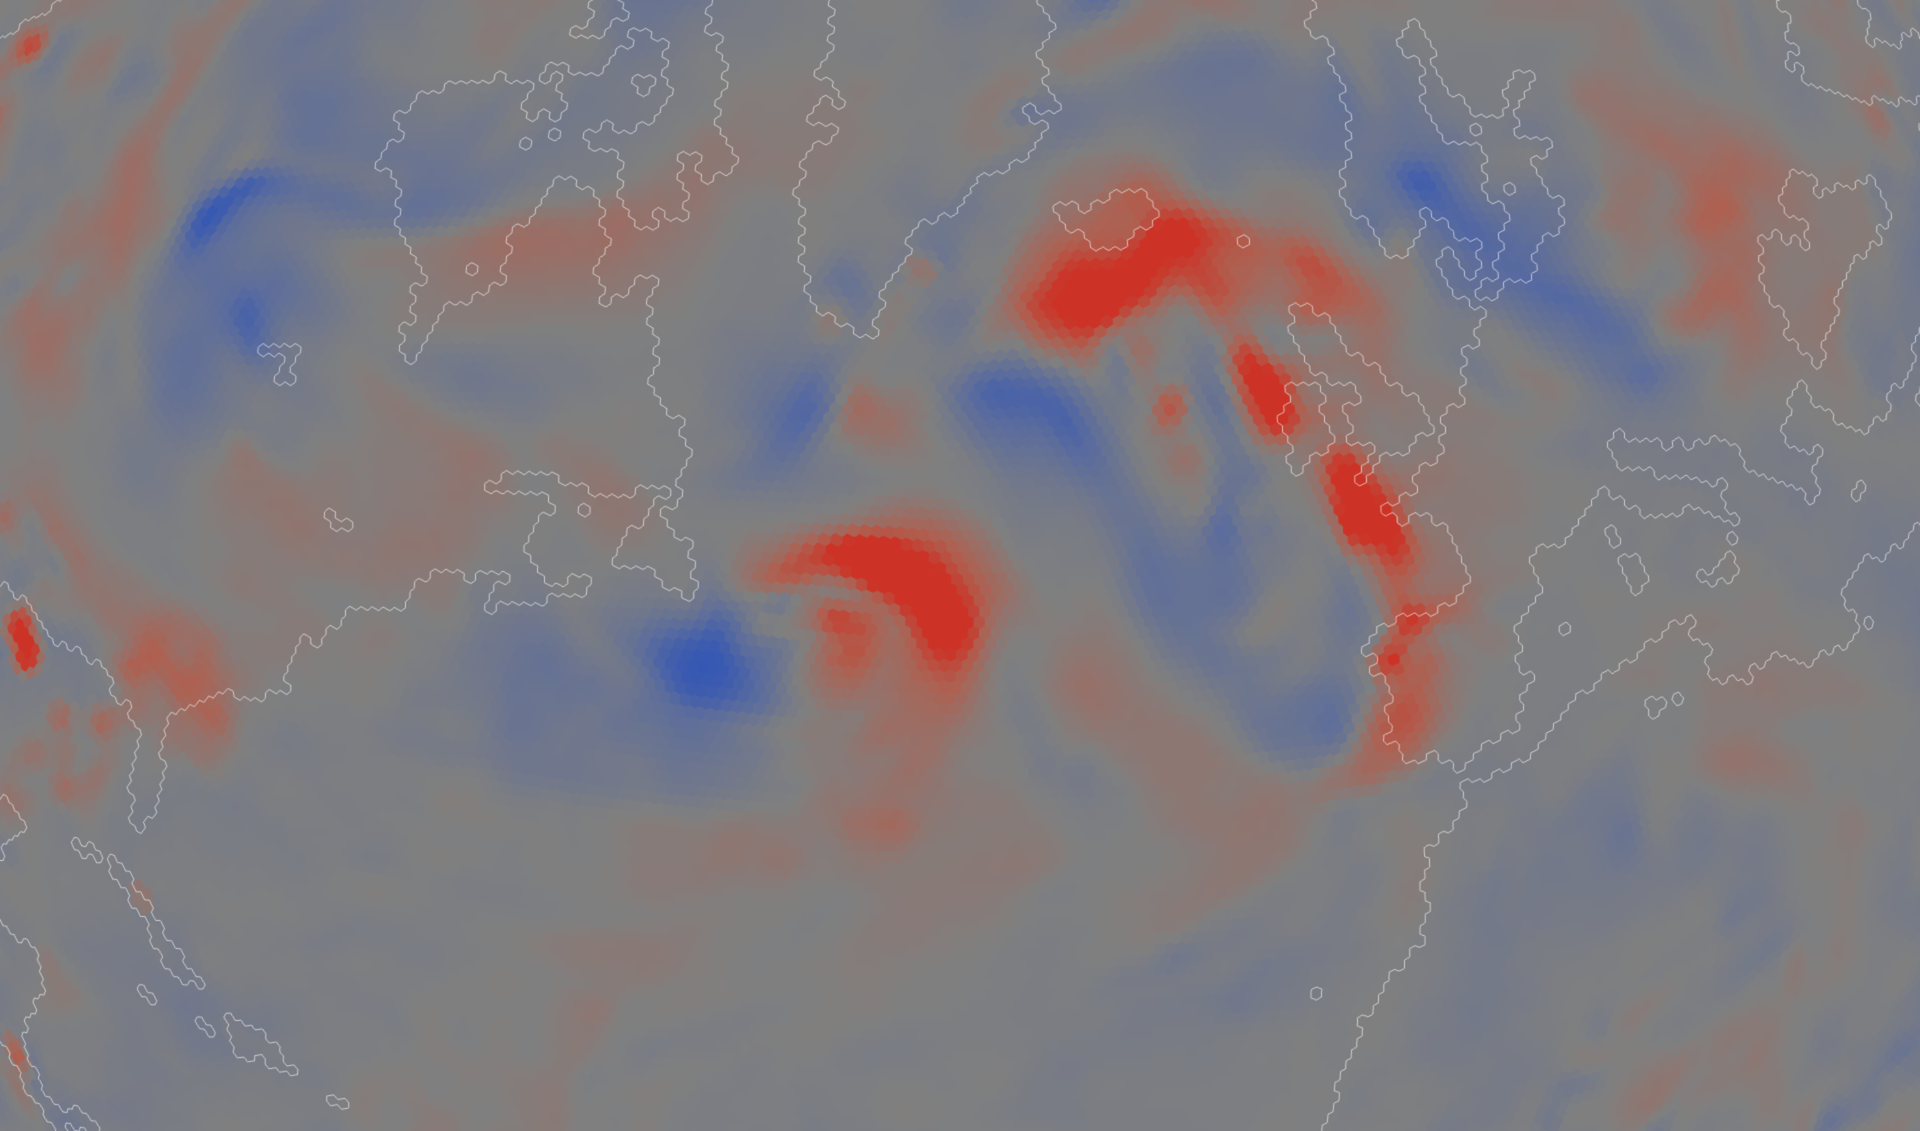
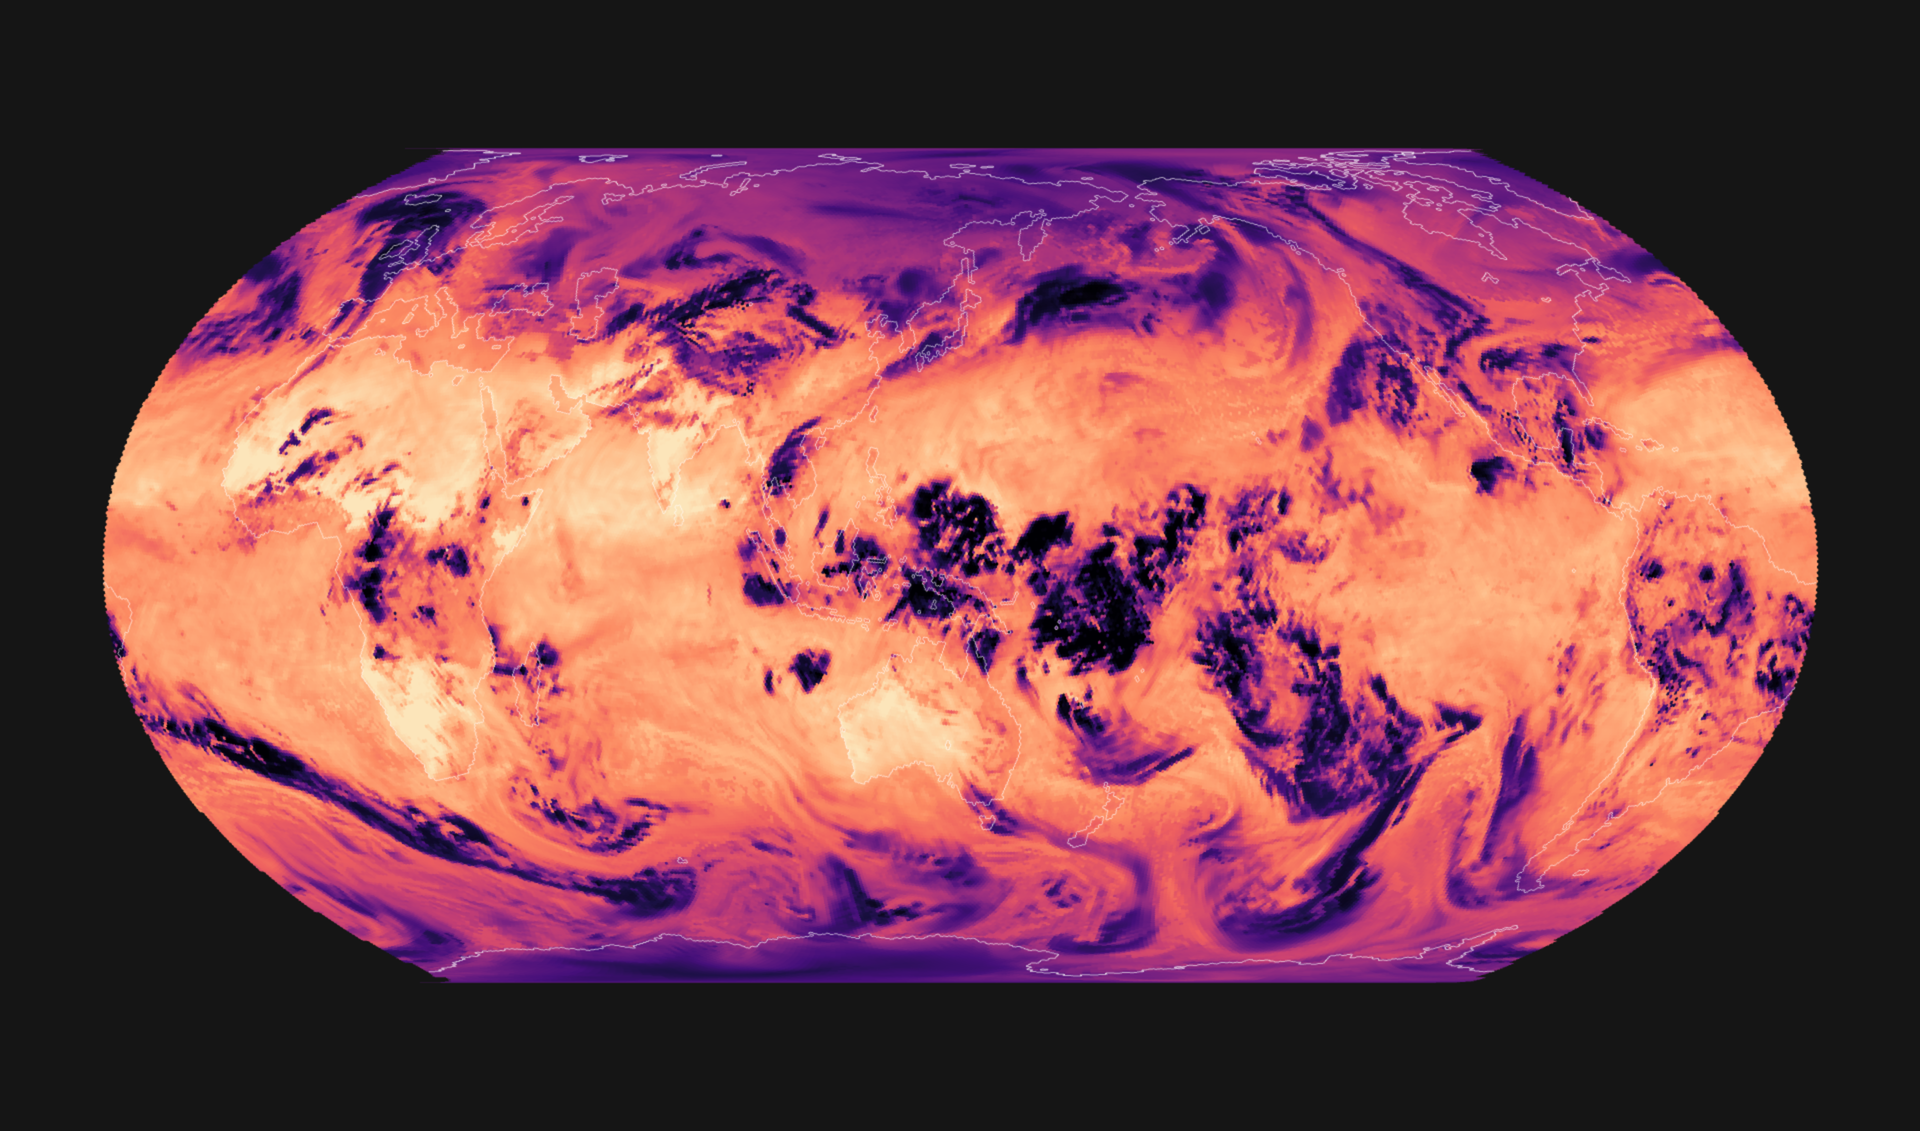
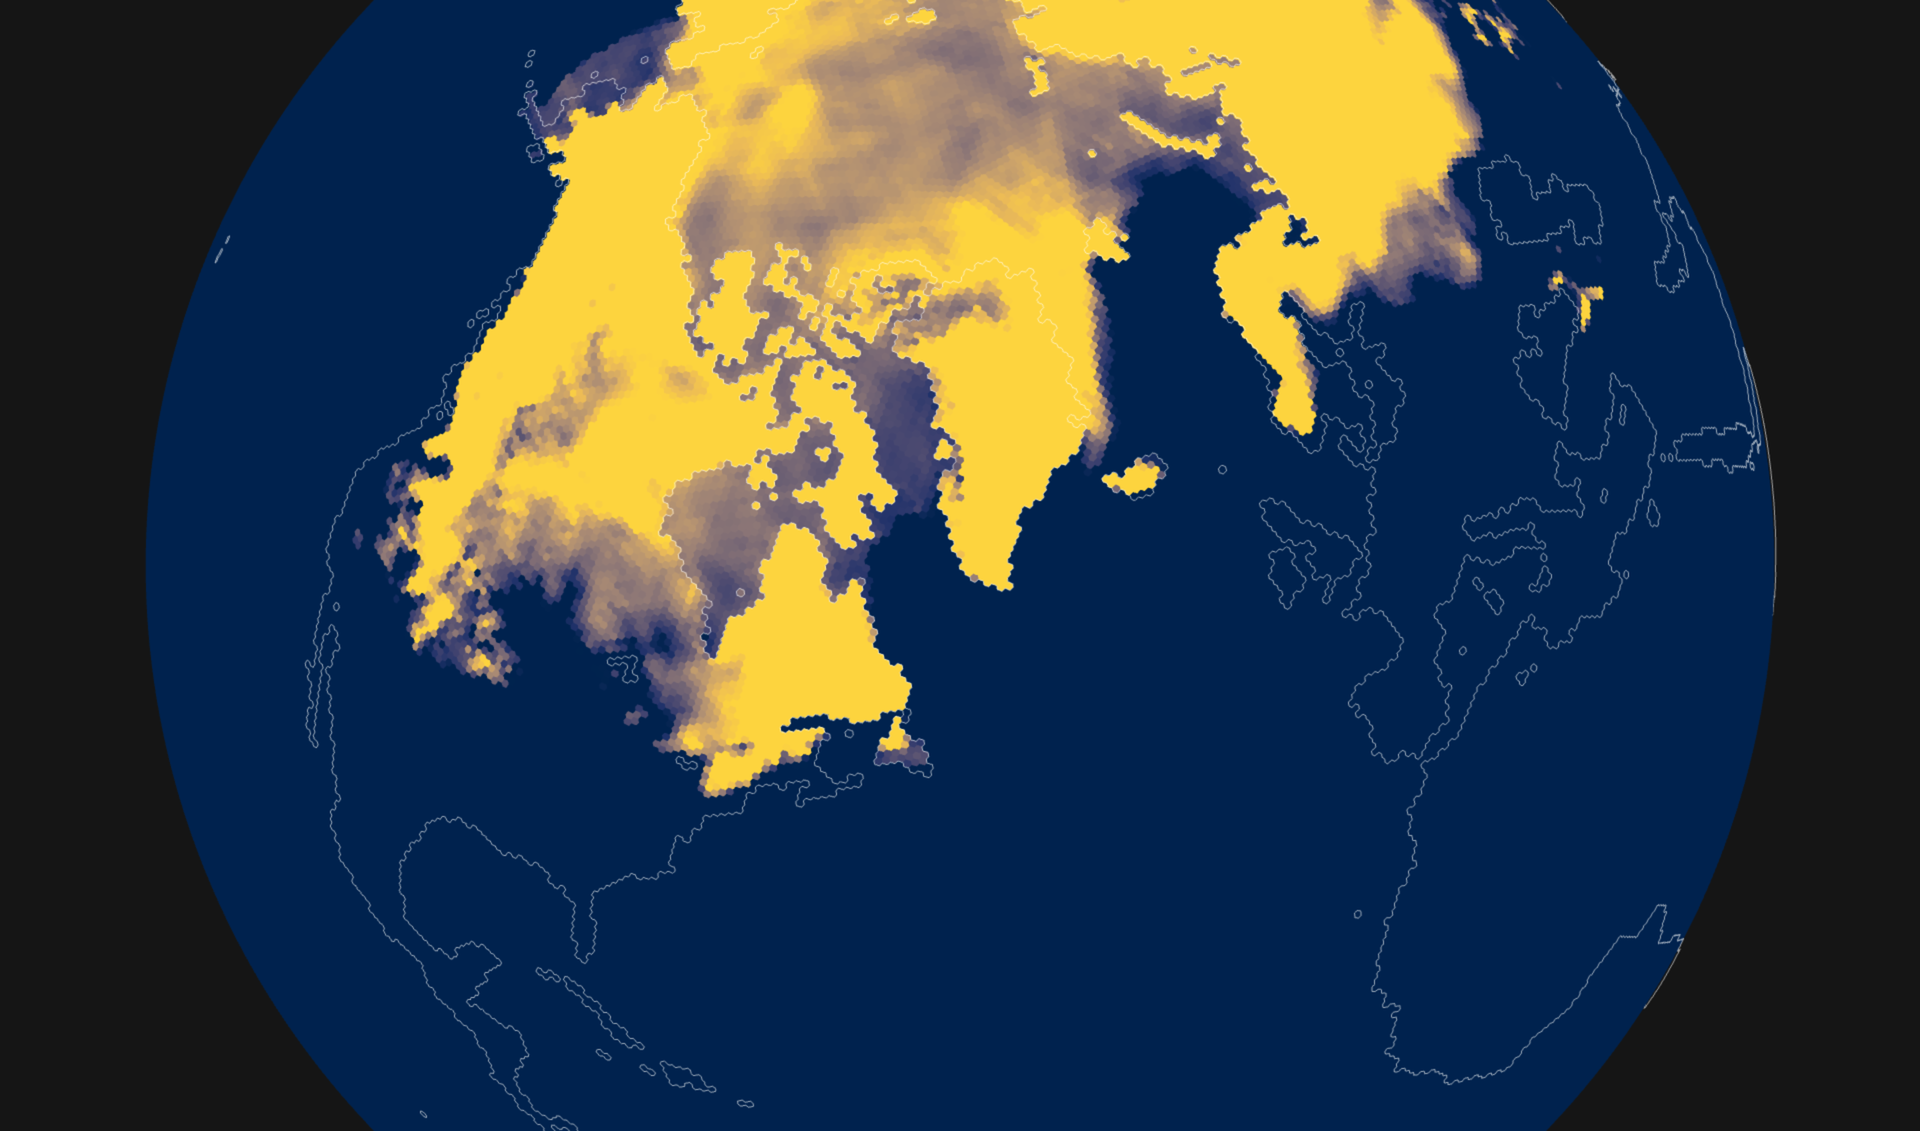
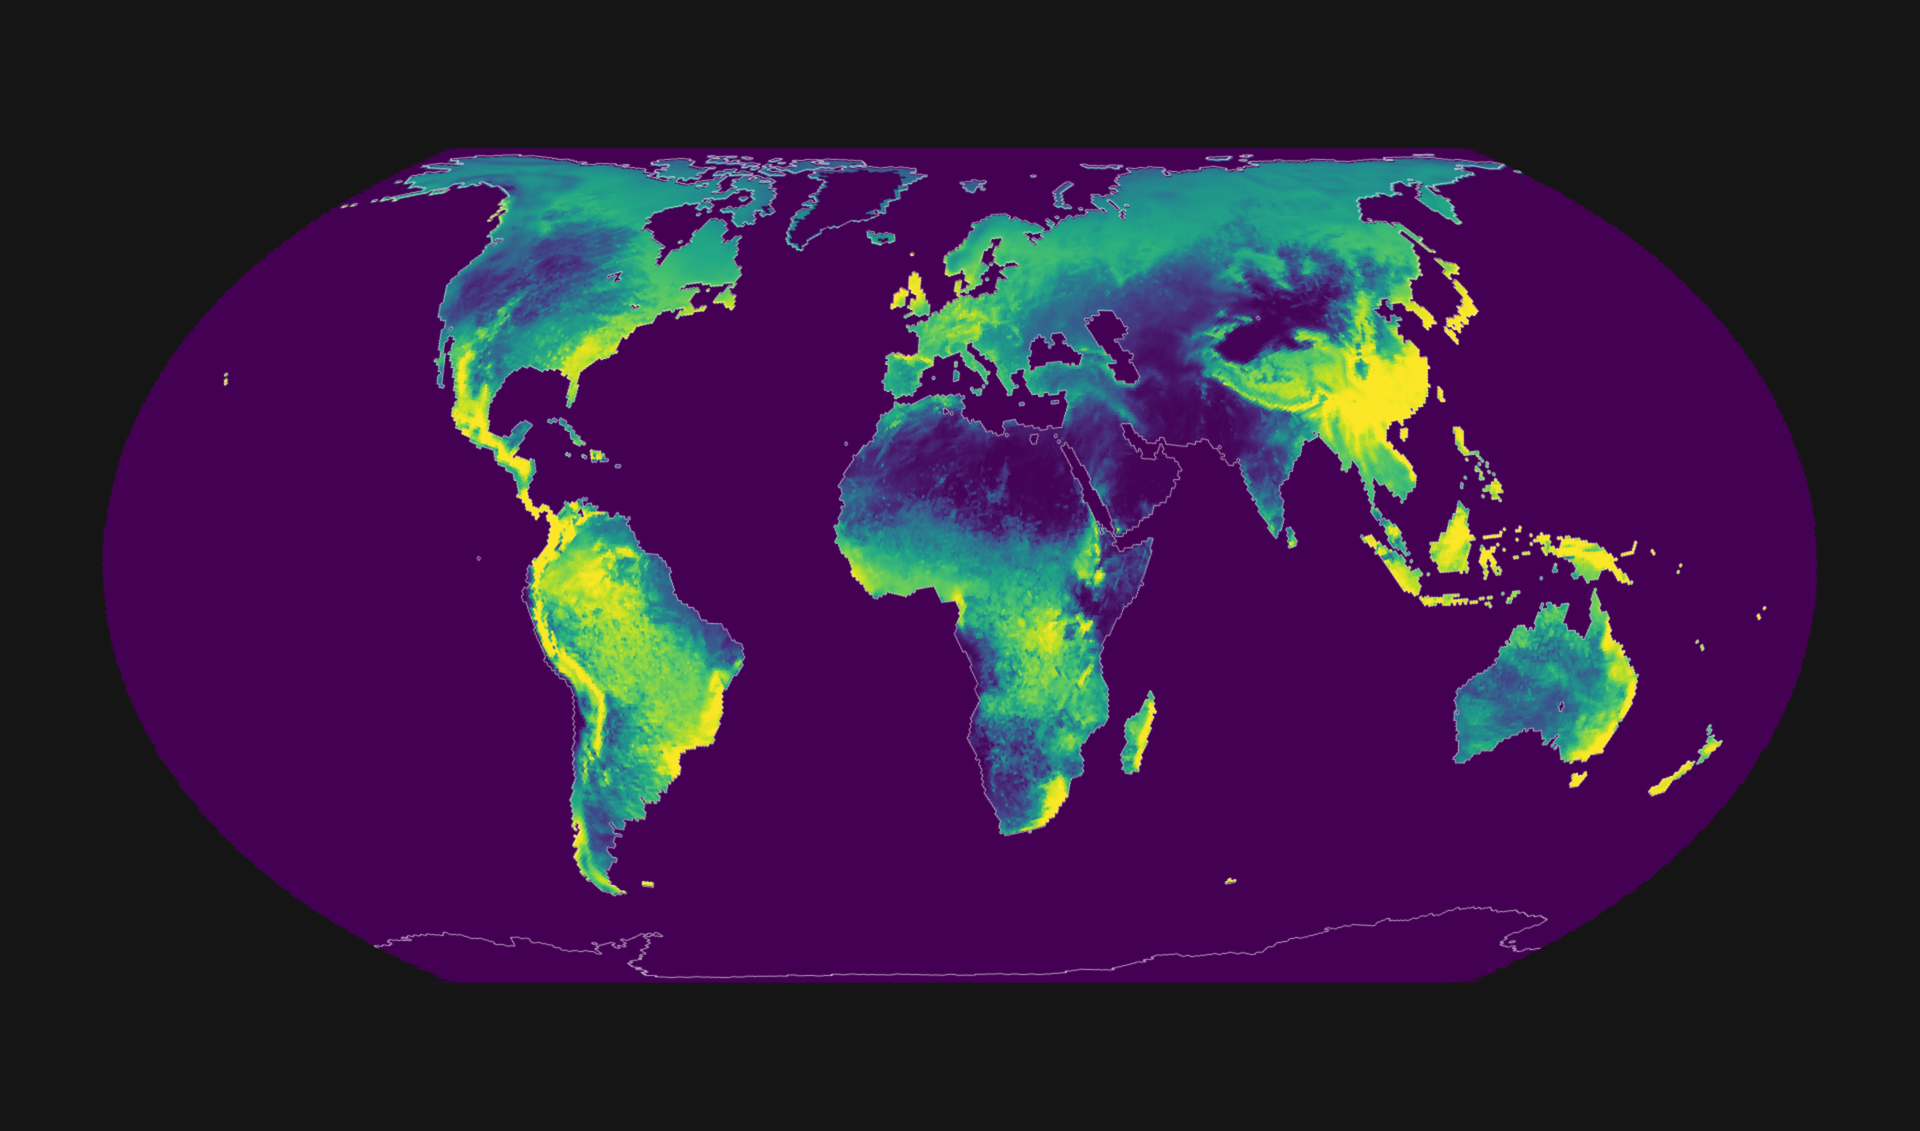
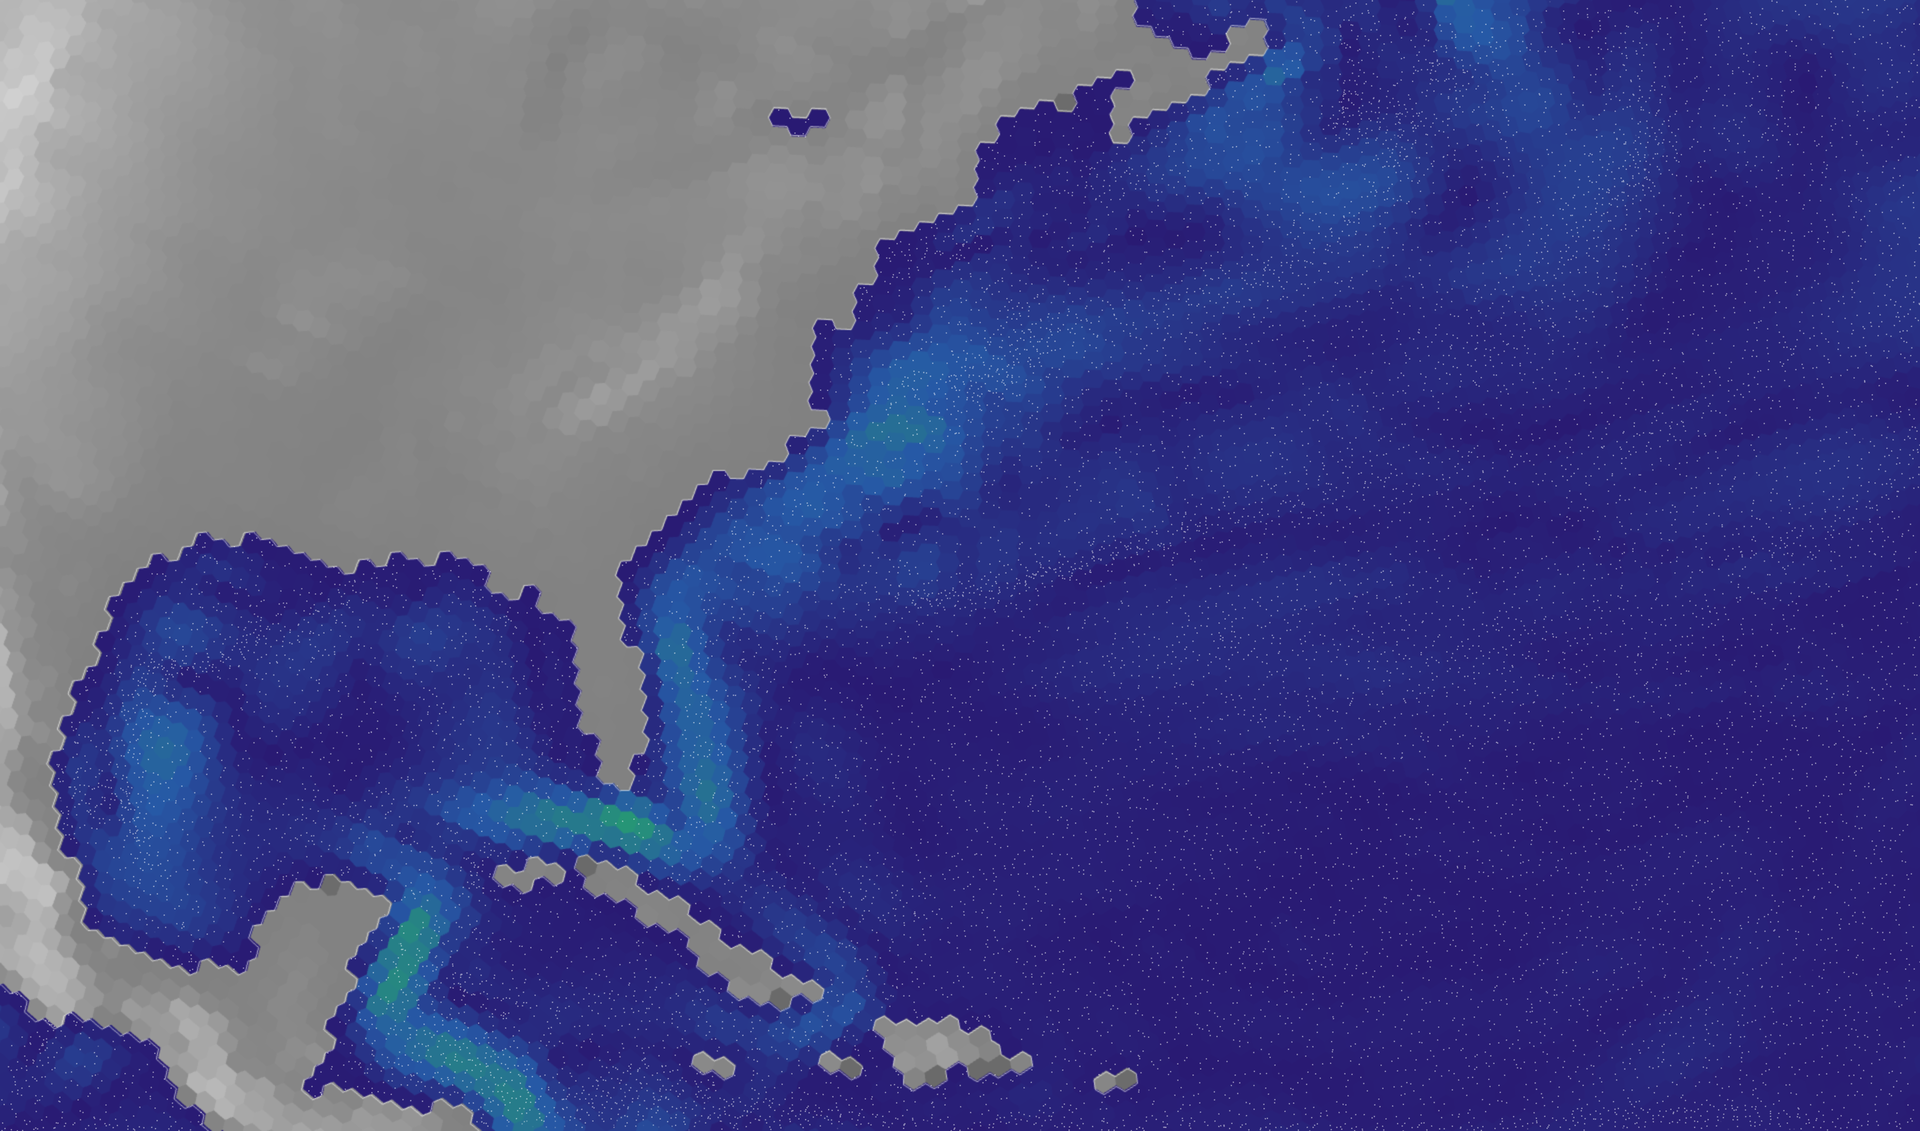
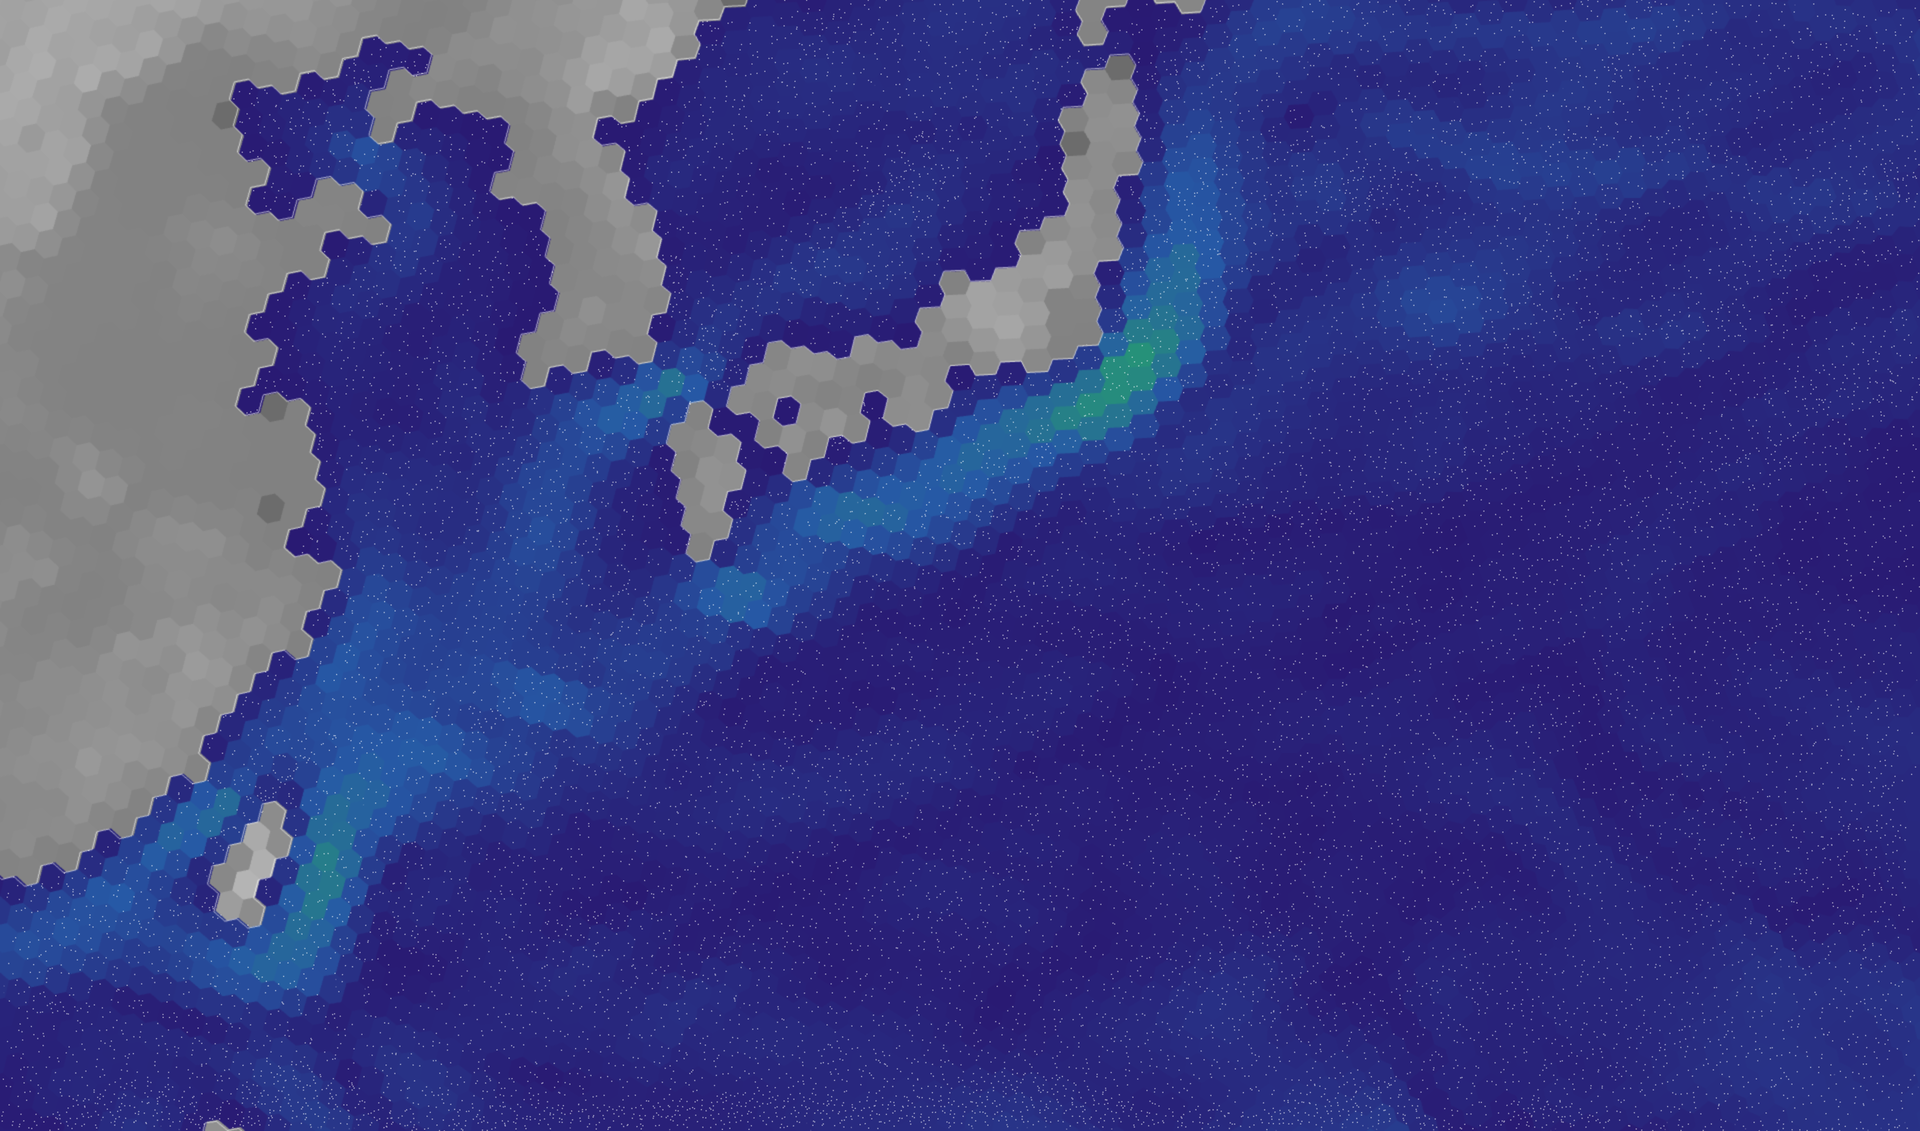
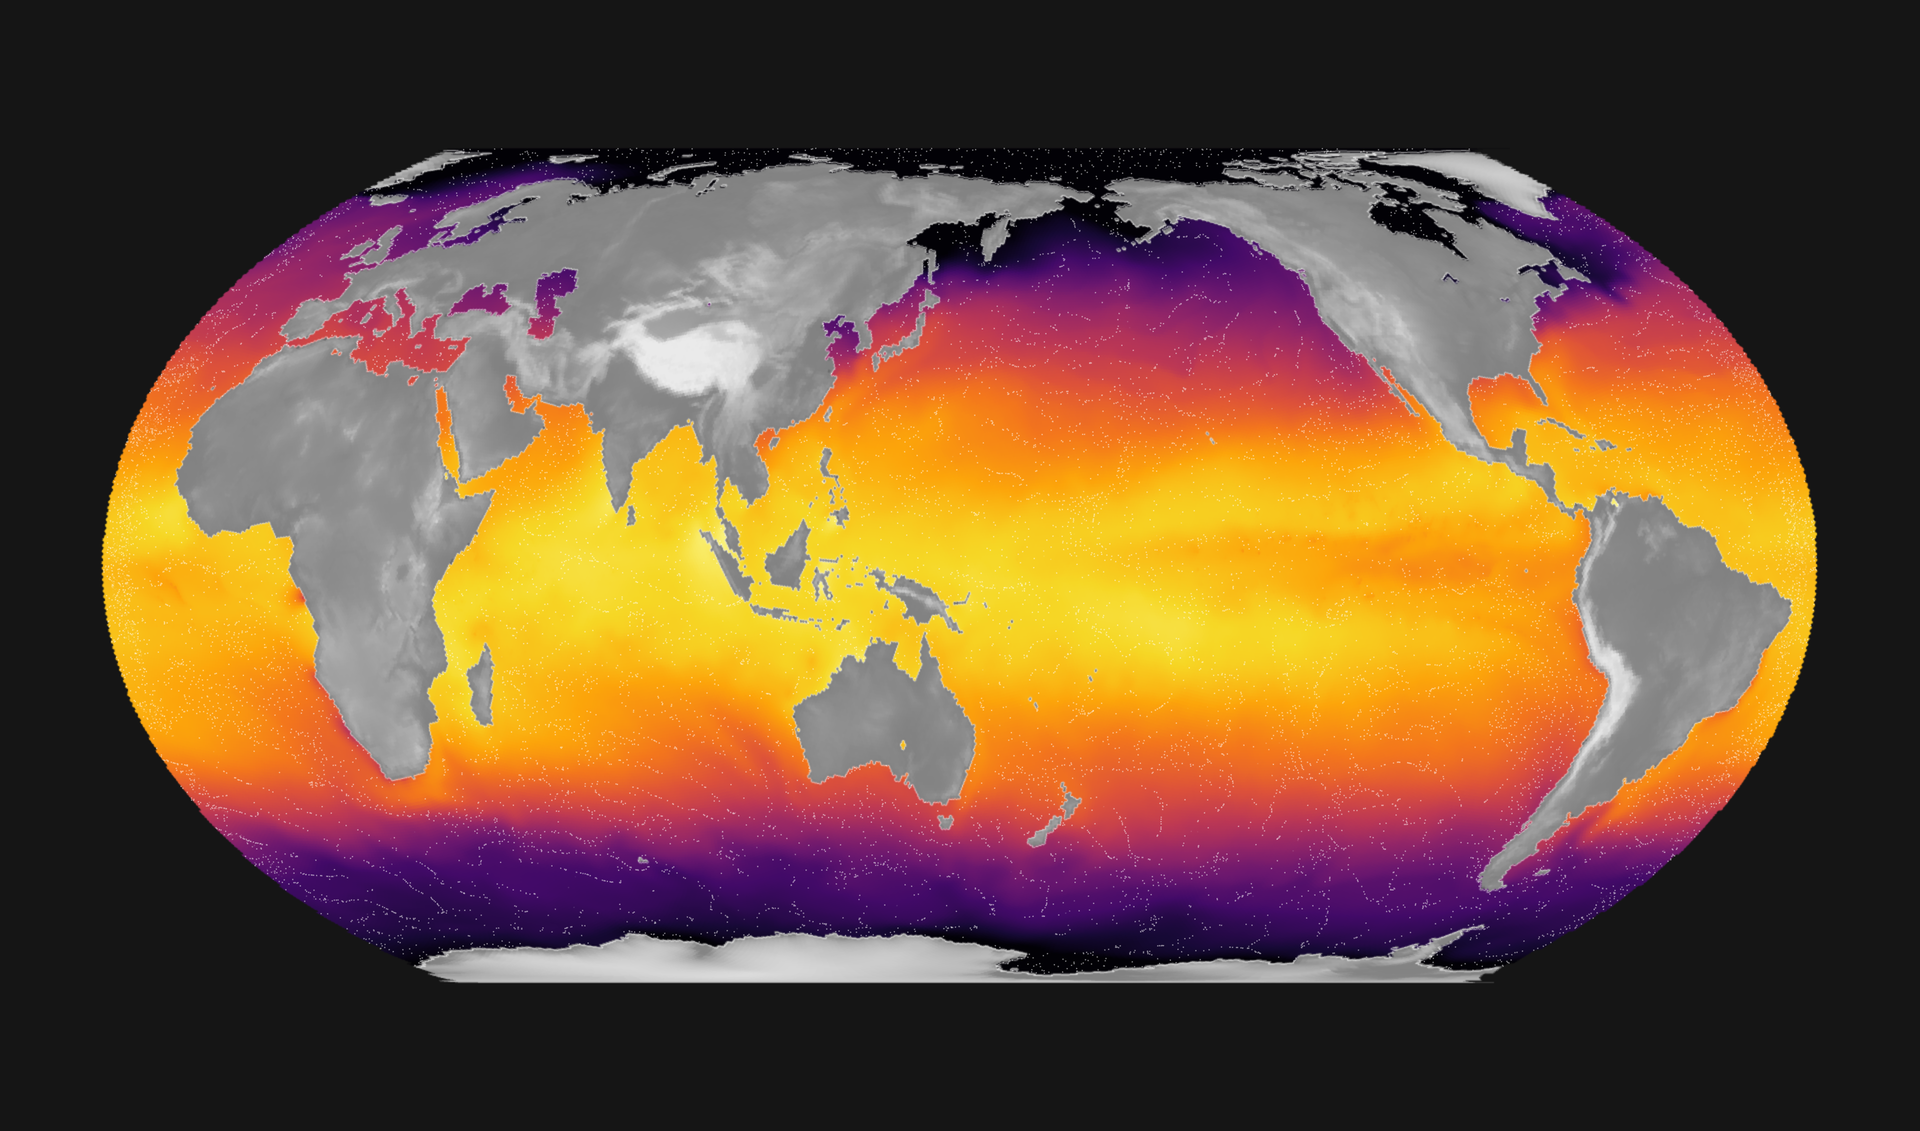
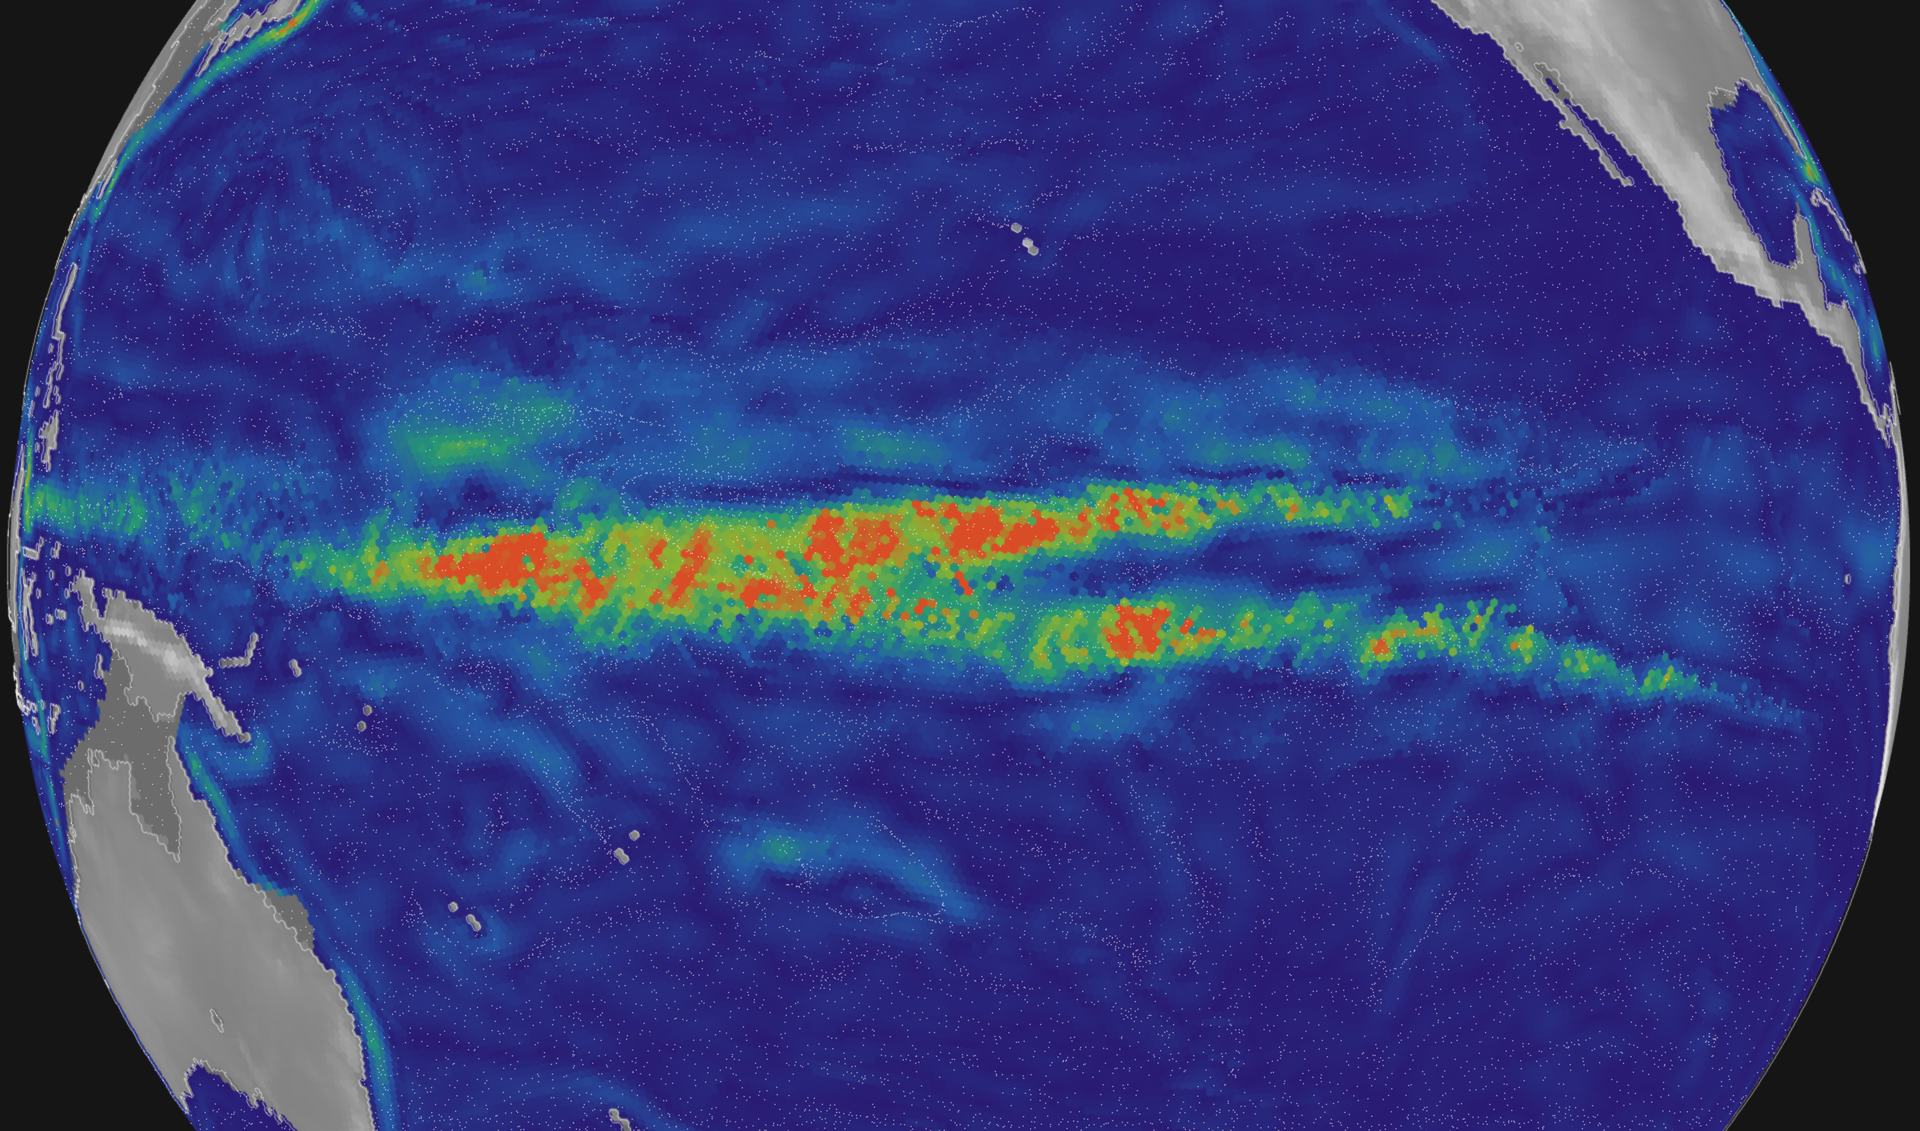
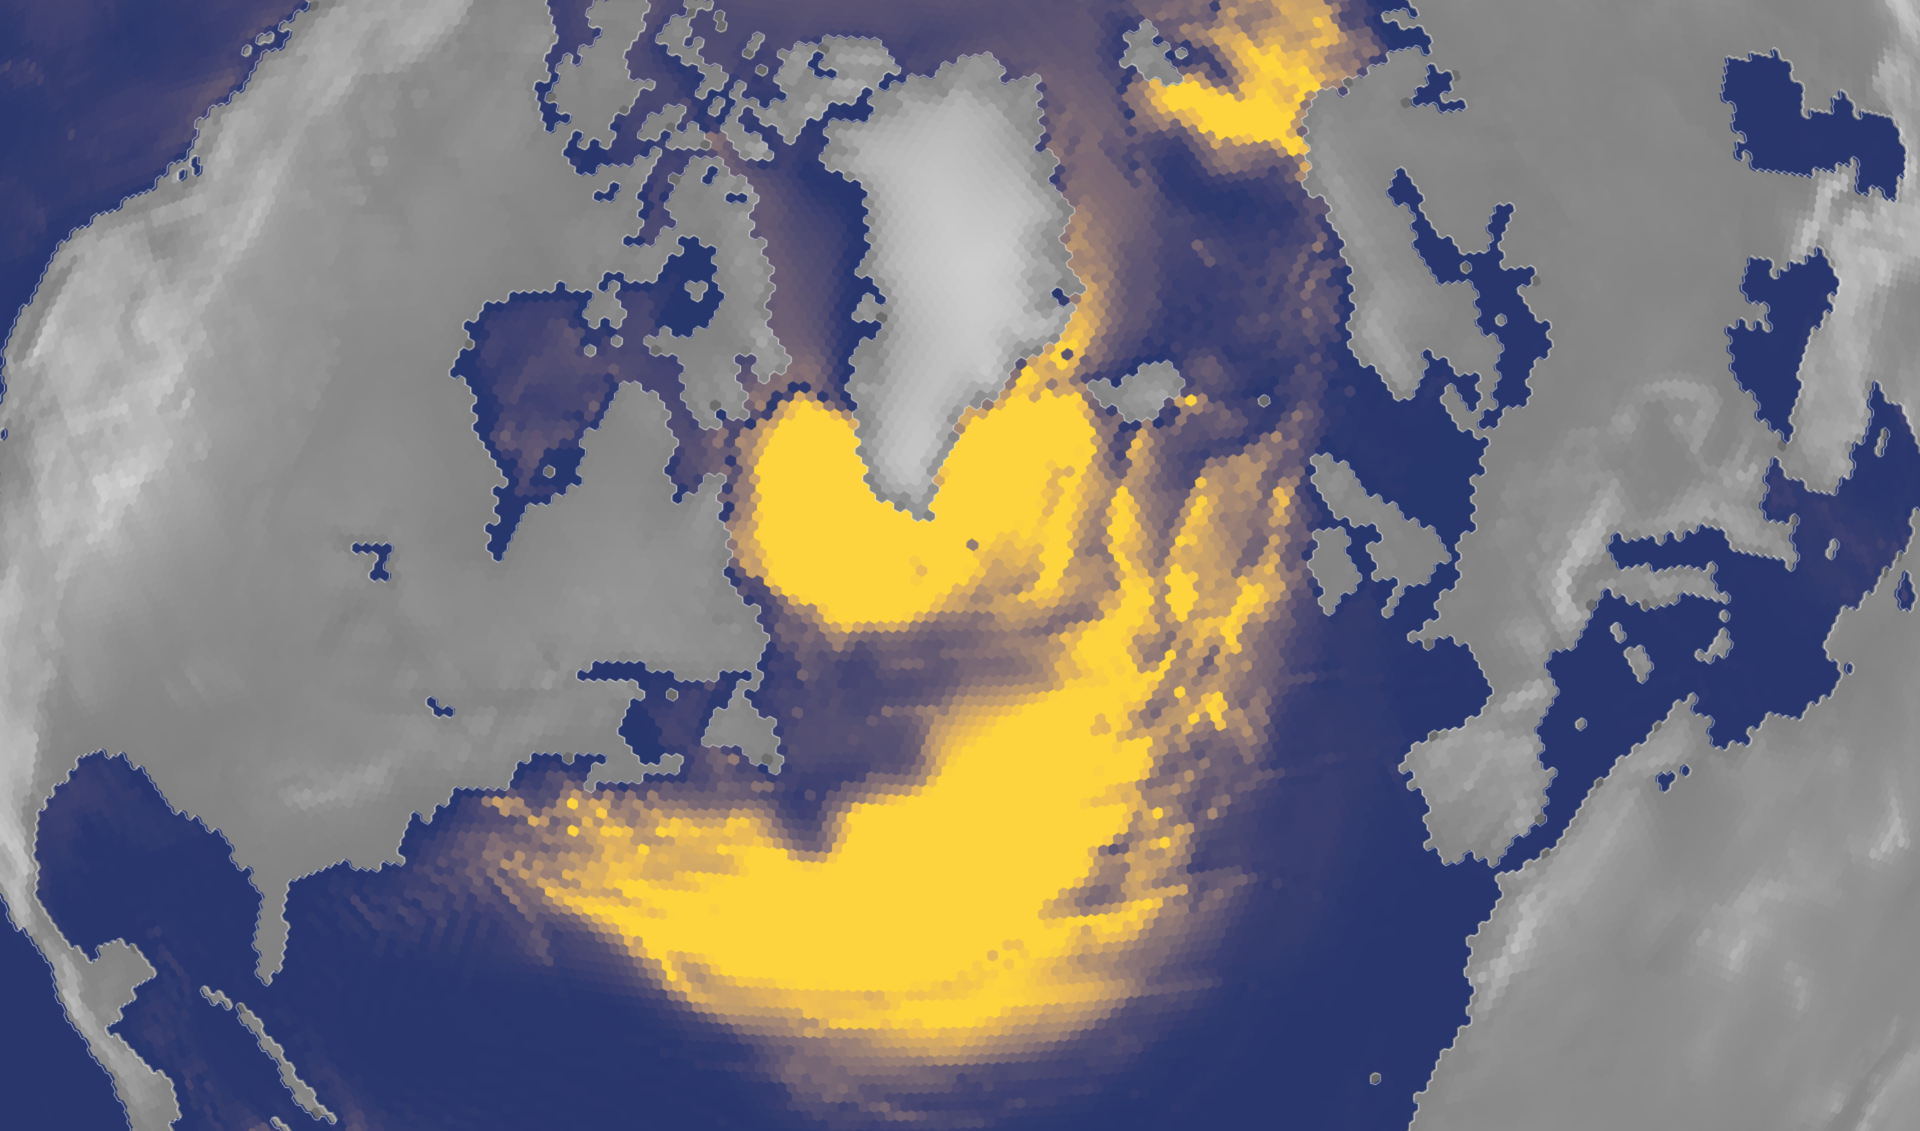
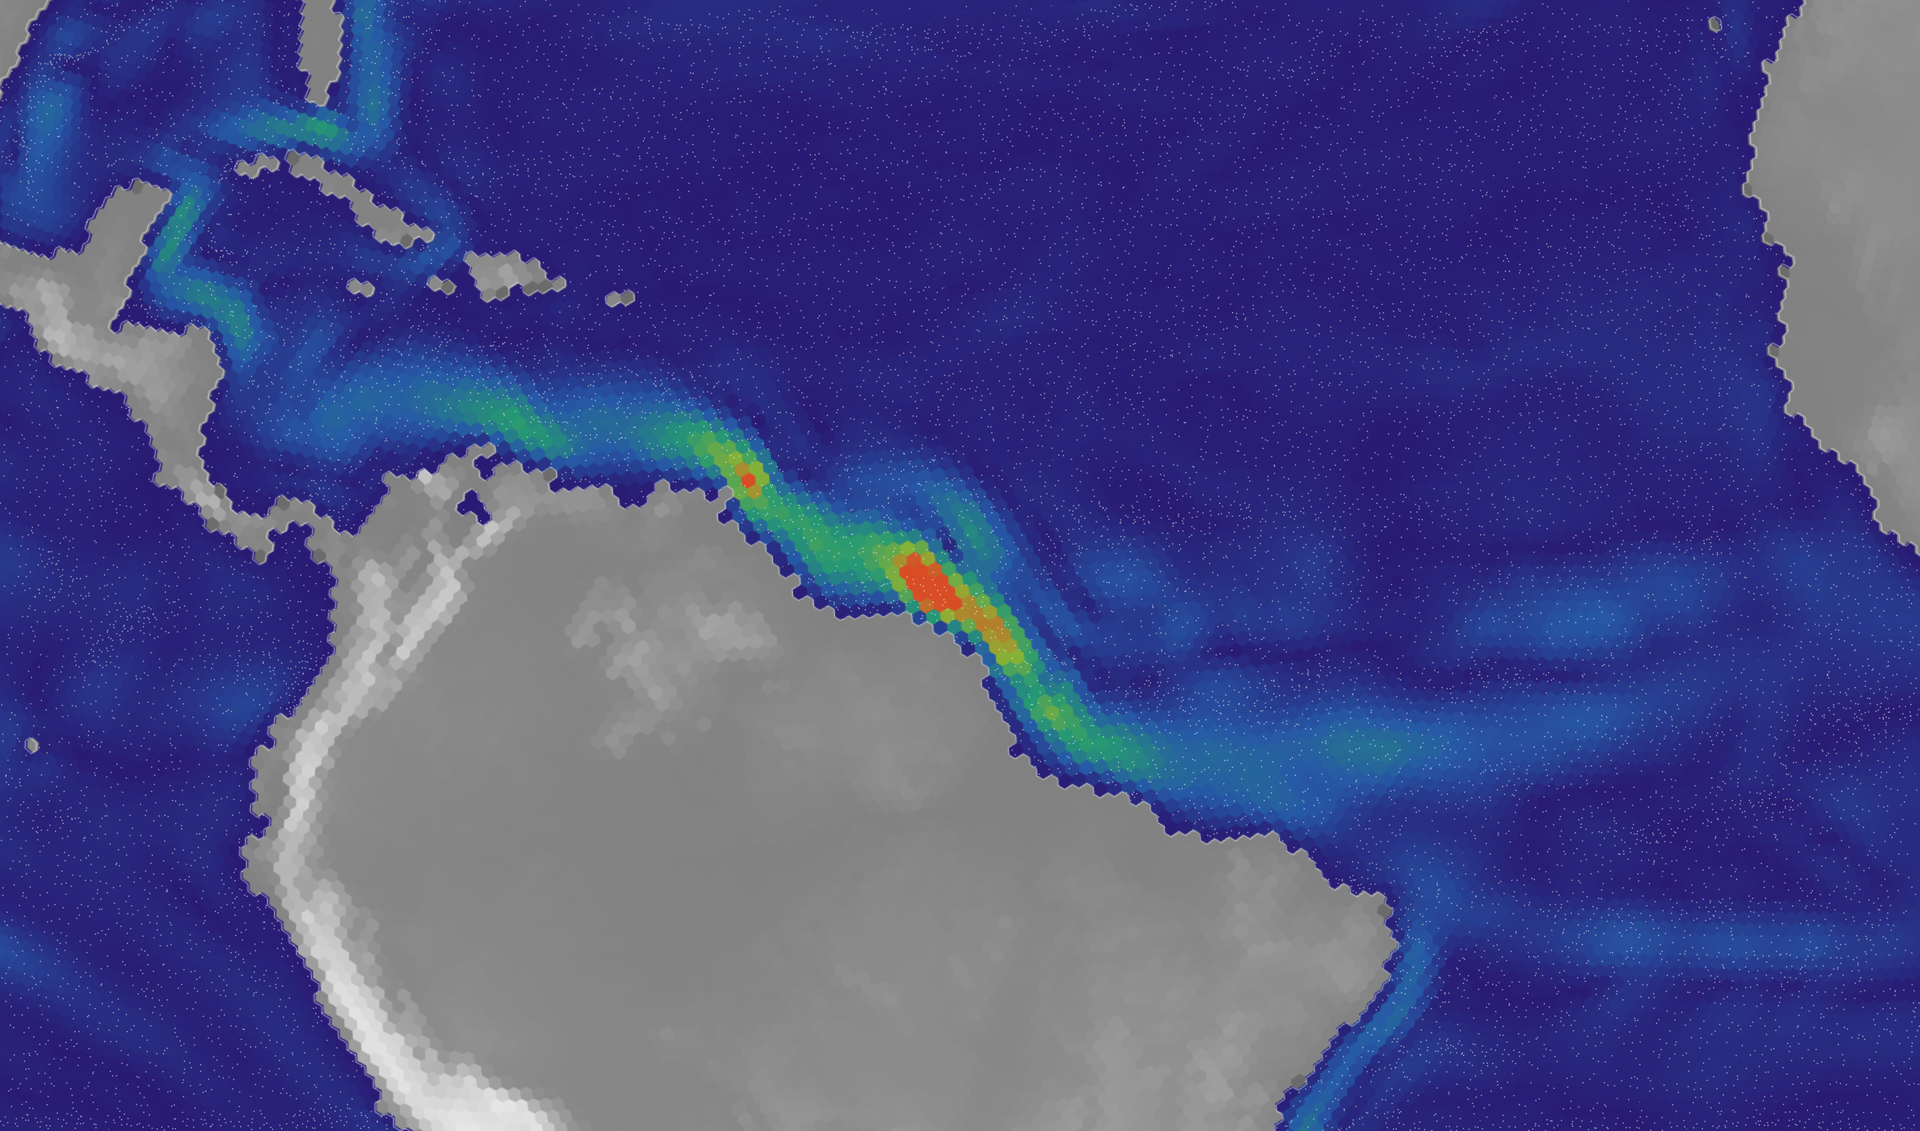
A global climate model running live: a hydrostatic atmosphere with 36 layers on a geodesic C-grid, moist convection and clouds, a 45-layer ocean with a mixed layer over 44 isopycnal layers, sea ice, snow, soil and vegetation on real continents with terrain. Every kernel runs on the graphics card through WebGPU. It picks up from day 1825, the March equinox at the end of a five-year spin-up, at up to 128 subdivisions on a desktop, about 164,000 cells 56 km across, or up to 64 on phones and tablets, about 41,000 cells 112 km across; the first time the page opens, a quick test picks the engine and the finest resolution your device runs well. You can color the globe by wind, temperature, pressure, rain, clouds, ice or ocean currents, draw isobars, follow the wind with particles or arrows, watch the planet from space, and save snapshots.
Best in a browser with WebGPU (Chrome, Edge or Safari 26). Without it the model falls back to a slower CPU engine. The starting state is a 244 MB download on a desktop and 62 MB on phones and tablets, kept in the browser after the first visit.
Open the climate model →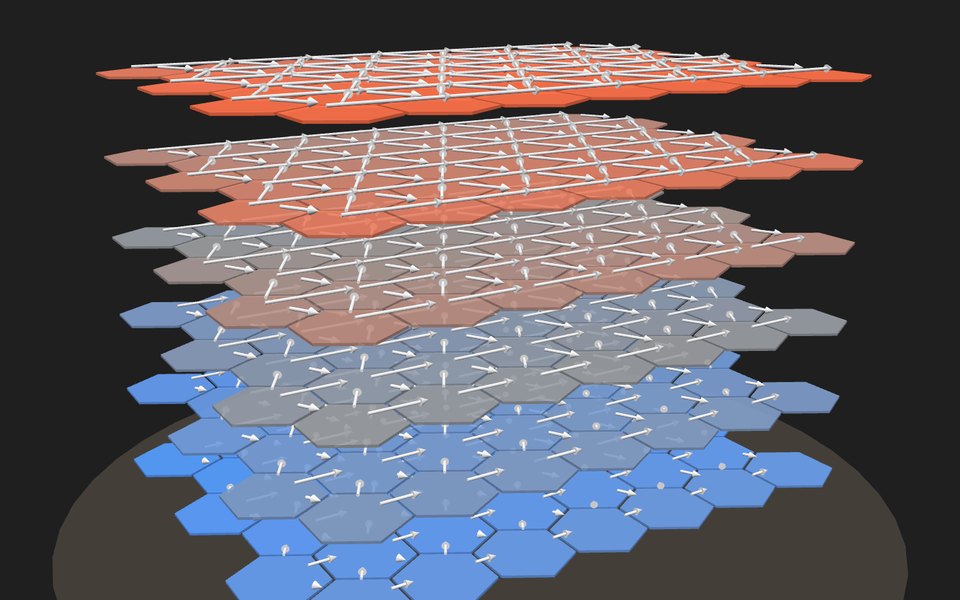
How WebGCM works
An illustrated explainer with live figures you can push on, building the model up from a single parcel of air: heating and lifting it, setting the planet spinning, covering a sphere with a grid, the primitive equations taken apart term by term, a dry atmosphere that makes its own jet streams and storms, a planet warmed by the real sun, the water that evaporates from its sea, condenses into cloud and rains, and the sea itself, which stores heat, is pushed by the wind into currents and freezes at the poles.
Start with part 1 →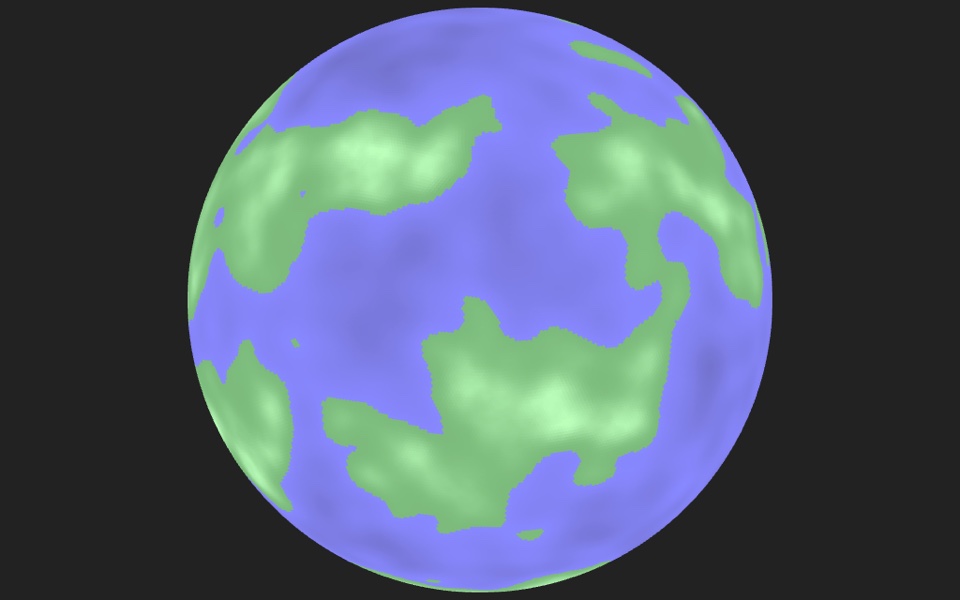
Geodesic grid
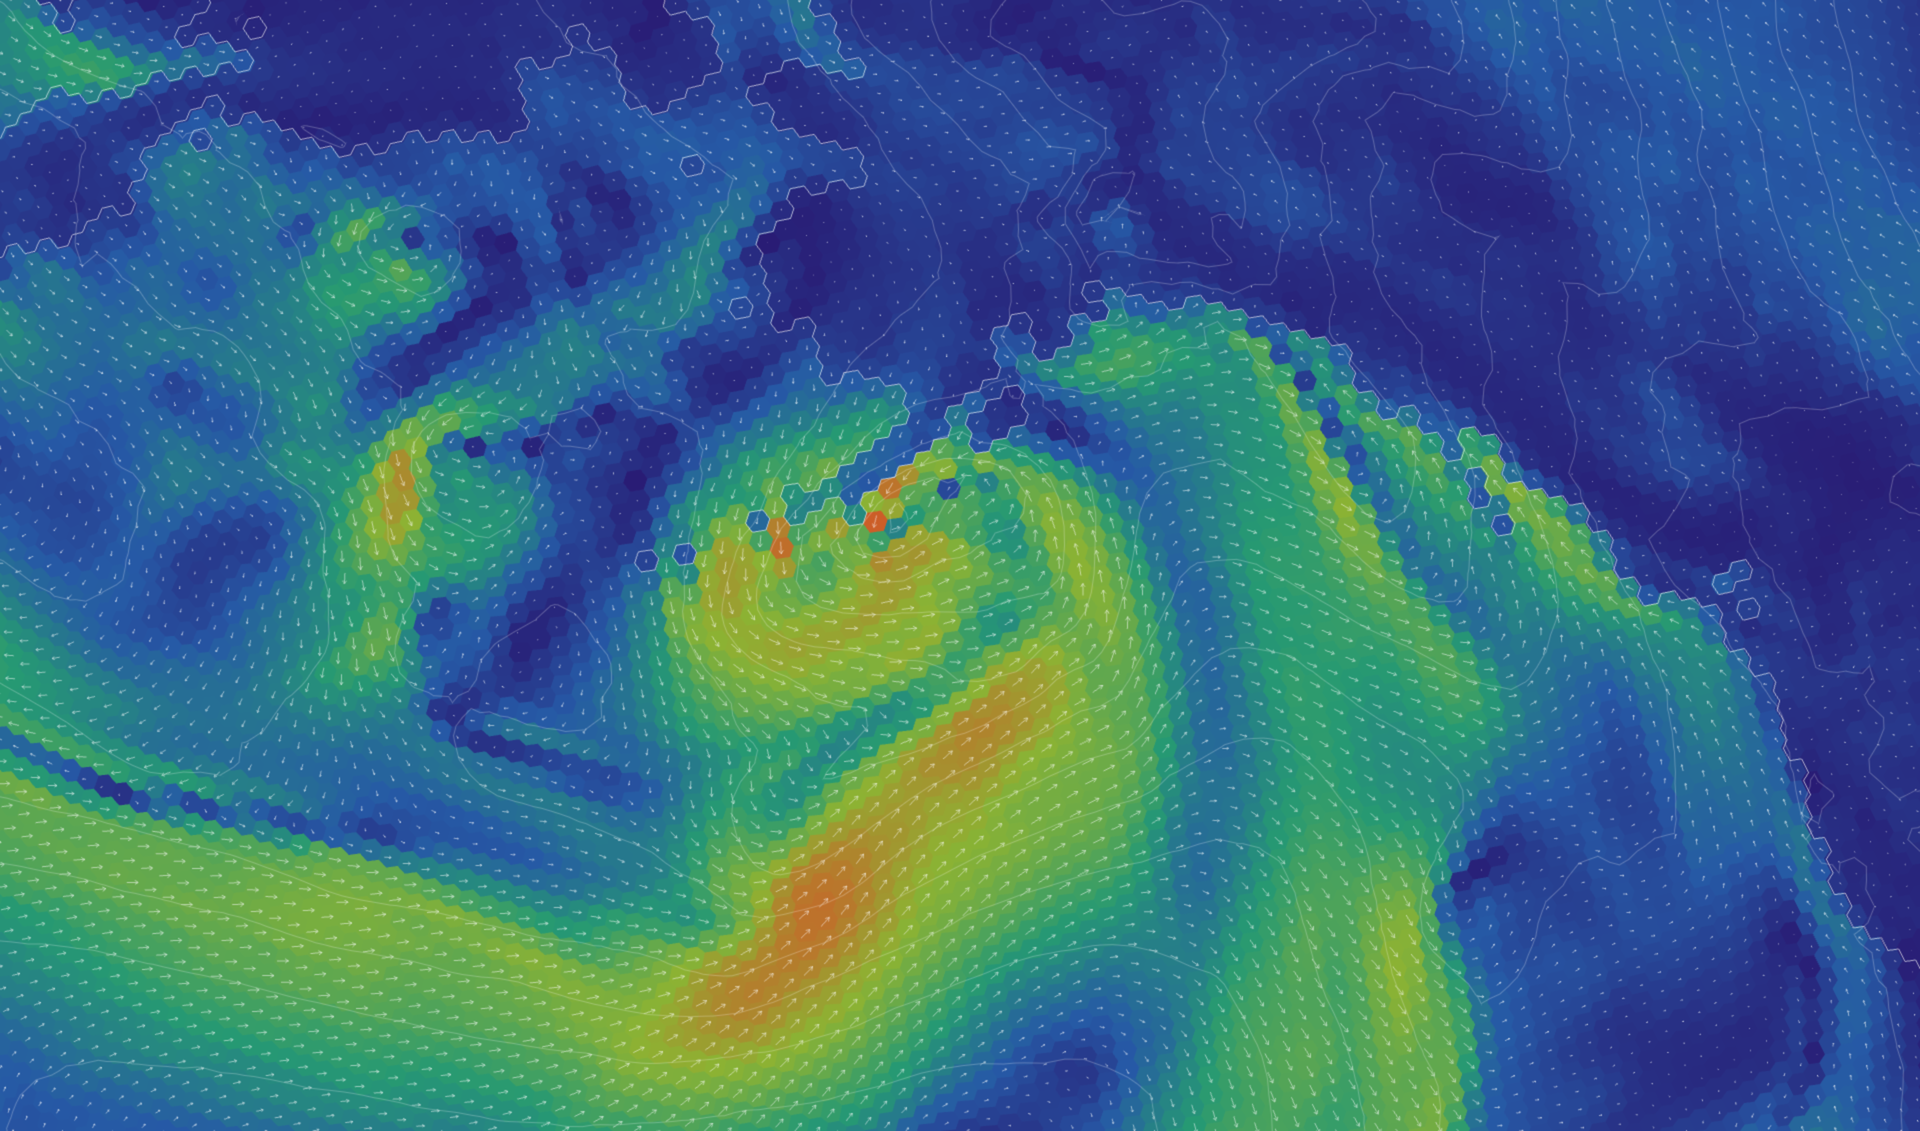
Where the project began, and where its repository got its name: an icosahedron subdivided into 100,002 cells, all hexagons but twelve pentagons, shaded by procedural terrain and rendered with Three.js. Drag to rotate, scroll to zoom.
View the grid →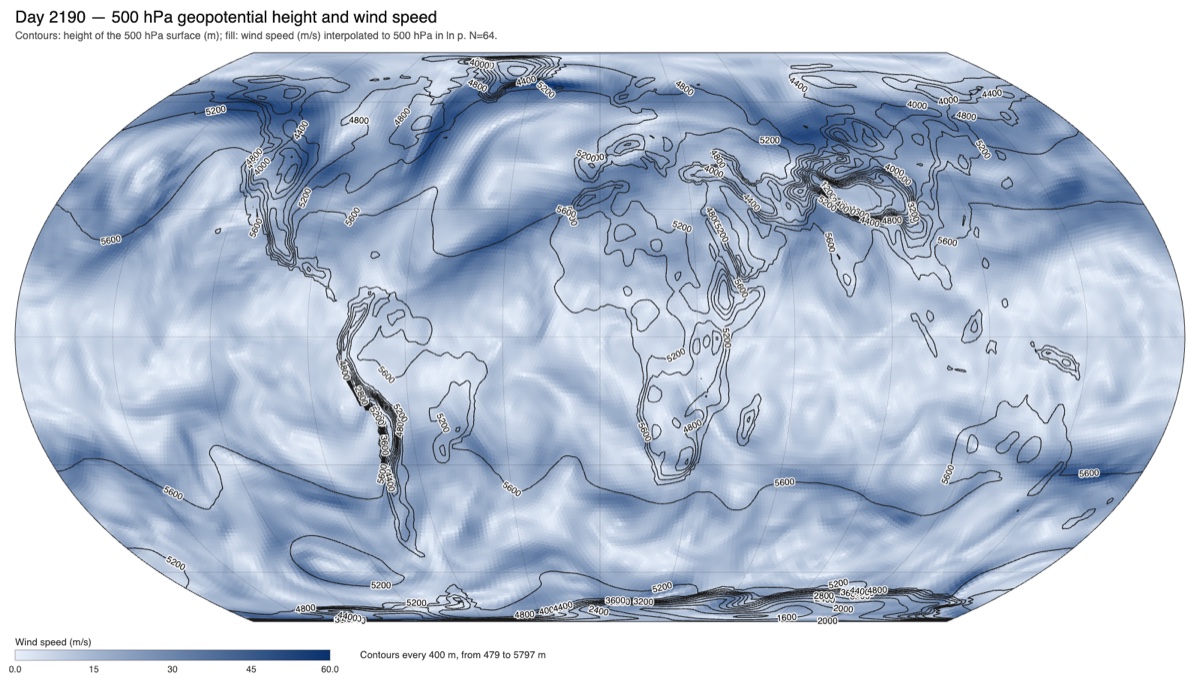
Synoptic charts
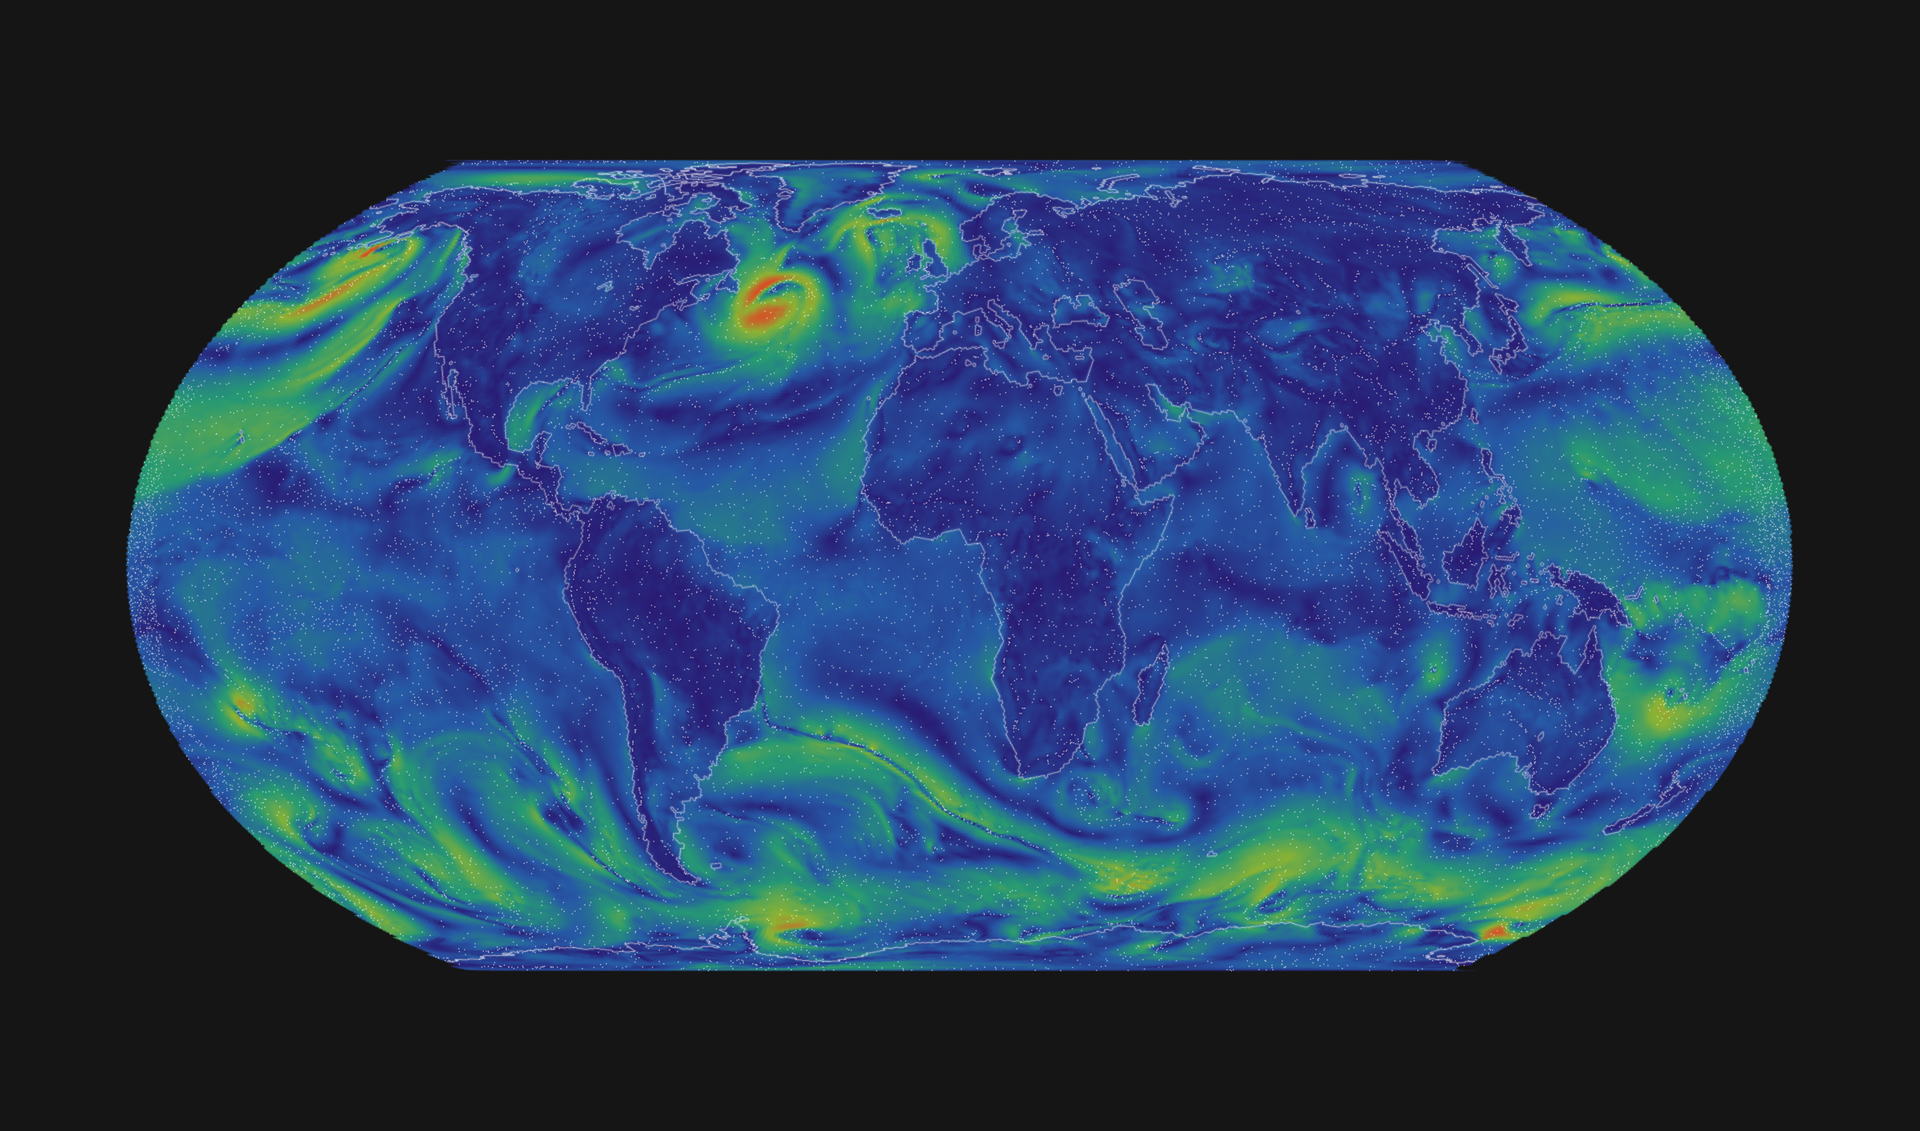
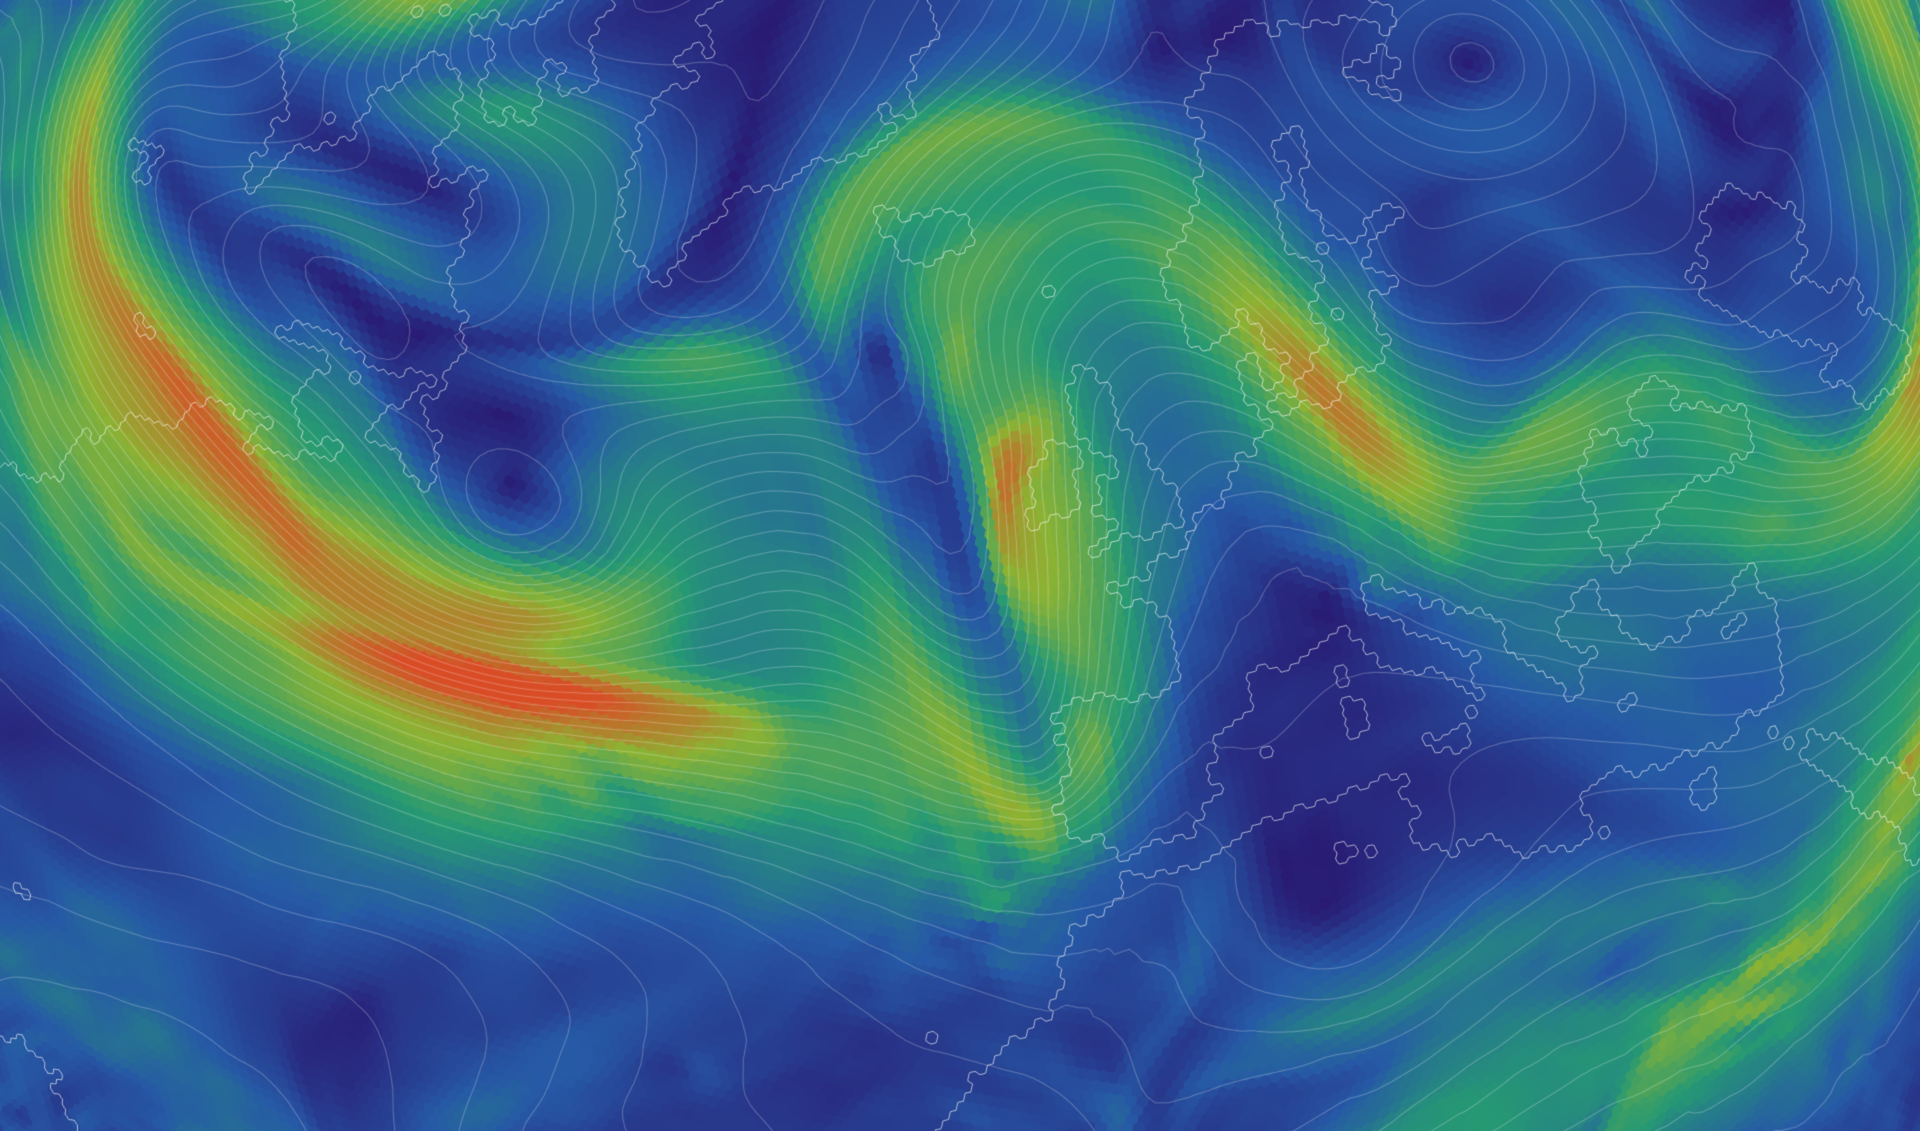
Weather-map plots drawn from saved model states: geopotential height contours and wind speed at standard pressure levels on an Equal Earth projection, downloadable as SVG or PNG.
Draw a chart →